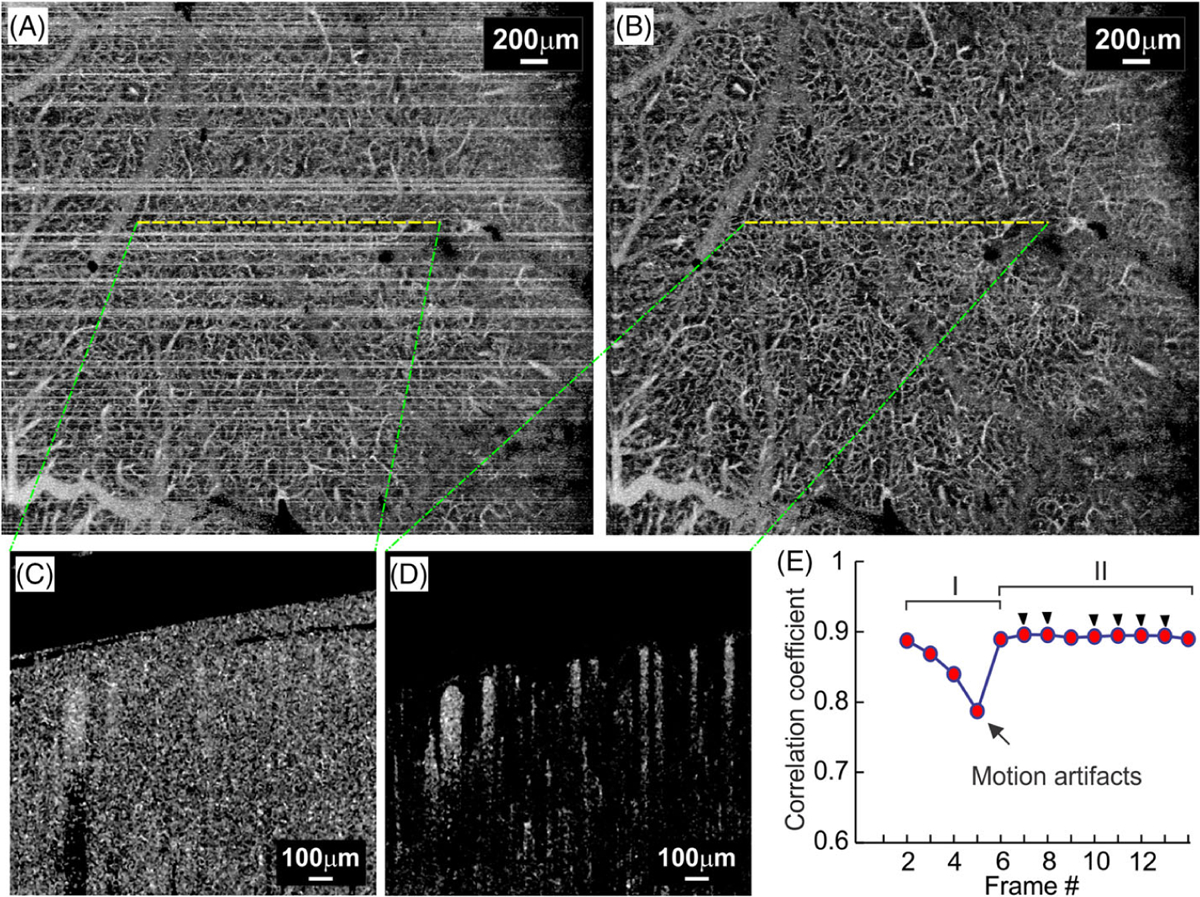
FIGURE 1.

Removal of bulk motion artifacts. A and B, ultrahigh-resolution optical coherence angiography (μOCA) images before and after motion removal; C and D, Cross-sectional μOCA images before and after motion removal; E, Plot of averaged correlation coefficient, in which periods I and II are declined r(i, j) due to motion artifacts and high r(i, j) for stable frames, and black arrow heads highlight the six frames with highest r(i, j) selected for μOCA calculation
