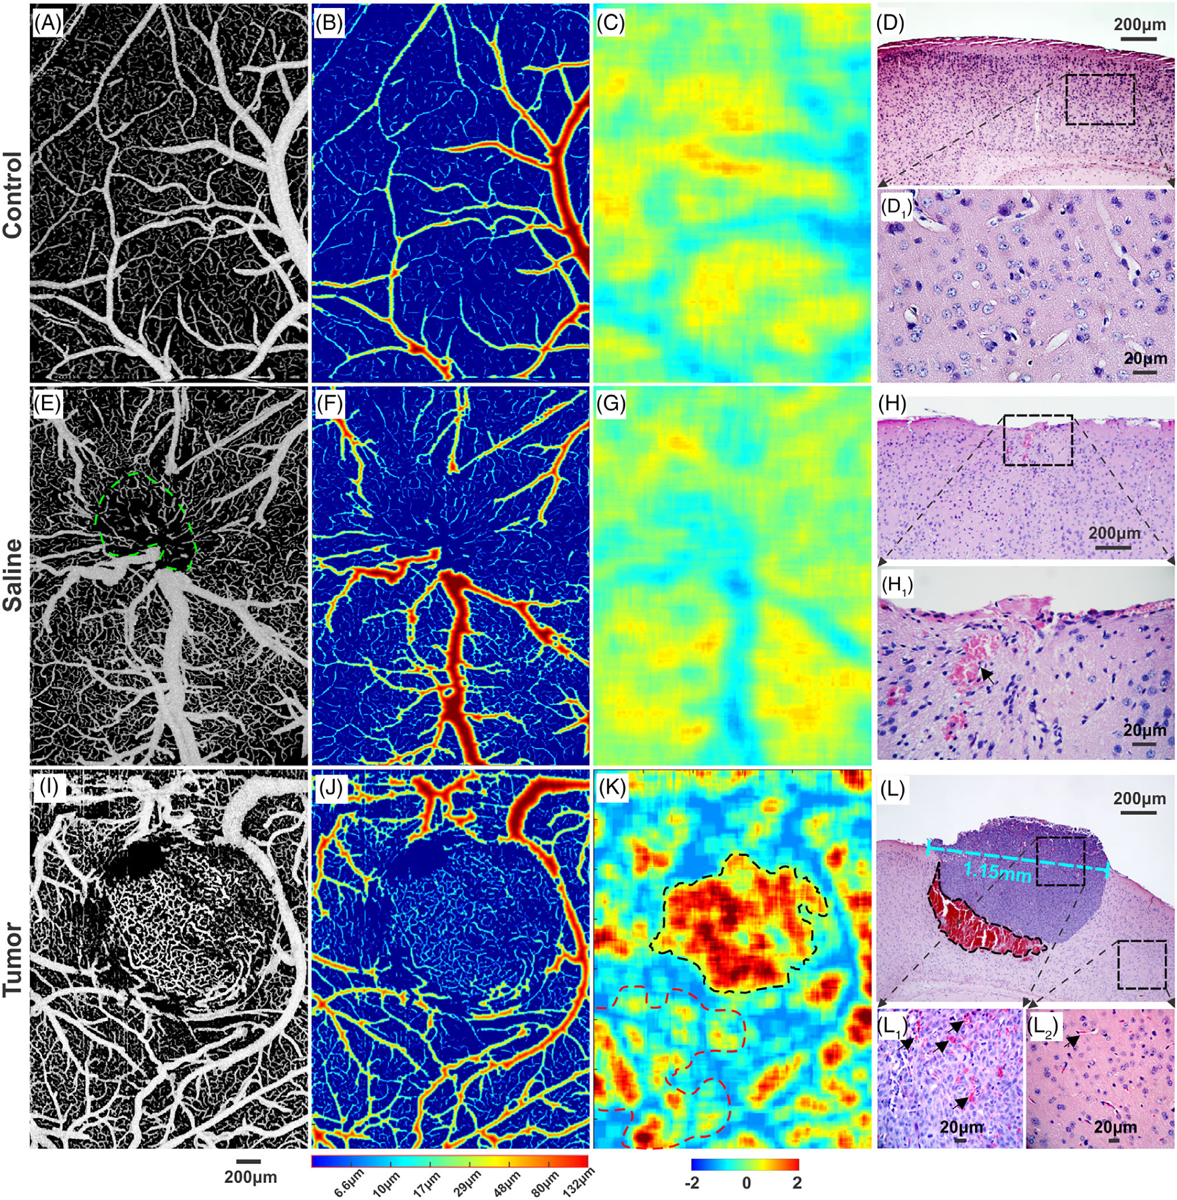
FIGURE 4.

A comparison of cortical vasculature among control, saline and tumor injected mice on day 18 after injection. A, E and I, ultrahigh-resolution optical coherence angiography (μOCA) images of vascular network of mouse sensorimotor cortex. B, F and J, vessel size maps to show vascular network heterogeneity. C, G and K, density ratio images. D, H and L, H&E stained histological images (4×) of brain tissue from normal, saline sham and tumor mice, respectively. D1 and H1, high-magnification (40×) images of (D, H); L1 and L2, high-magnification (40×) images within the tumor and the surrounding normal tissue, respectively. The size of the solid tumor was approximately 1.15 mm (panel L) on day 18 after intracranial injection
