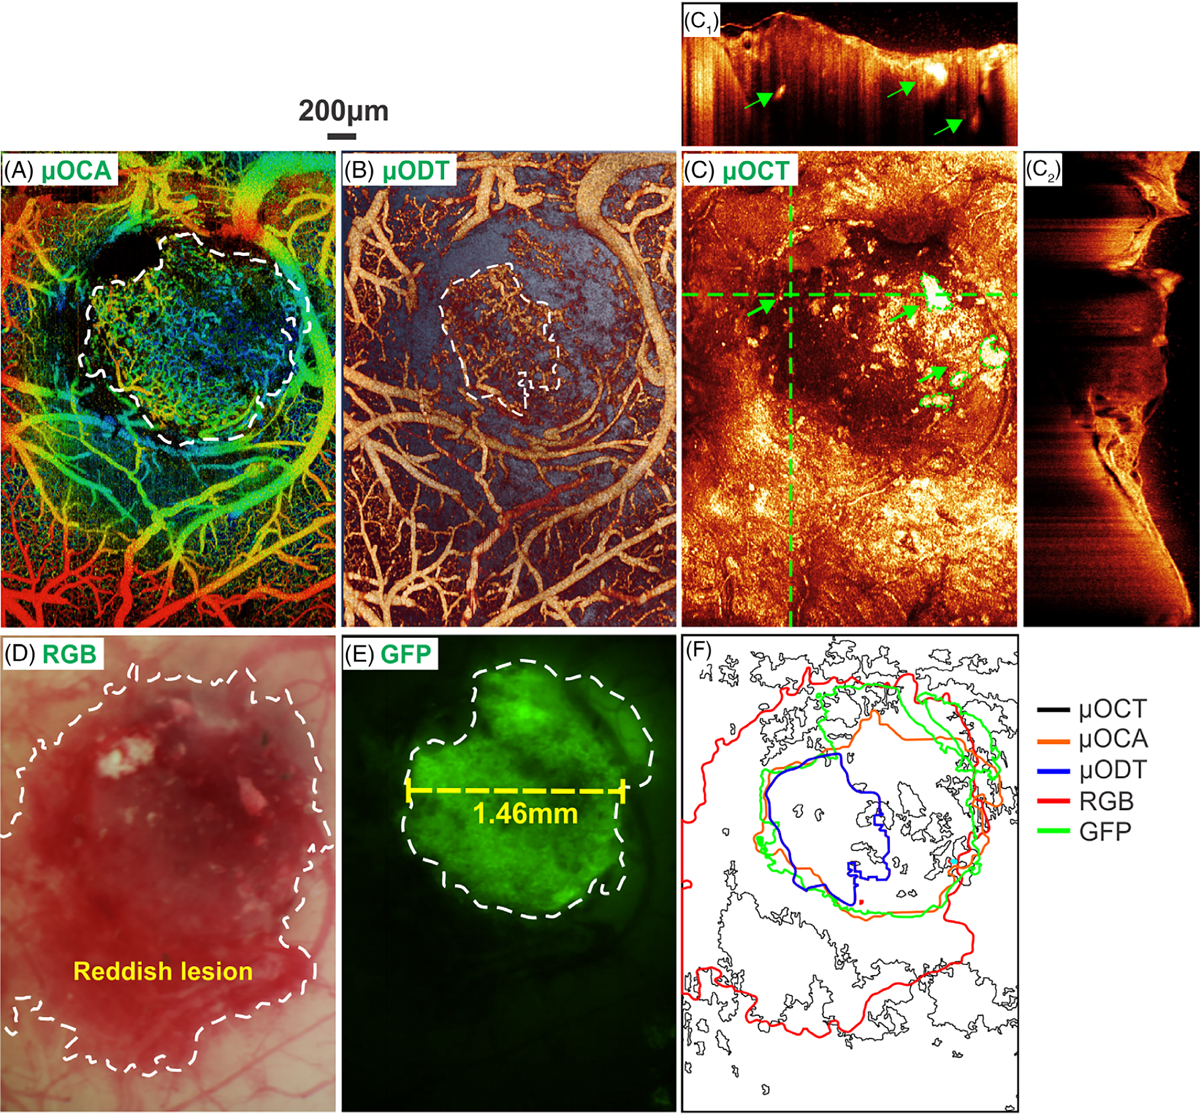
FIGURE 5.

In vivo detection of tumor boundary by various imaging modalities. A and B, en face depth-encoded ultrahigh-resolution optical coherence angiography (μOCA) and ultrahigh-resolution optical Doppler tomography (μODT). C, en face optical coherence tomography (OCT) image, in which panels (C1) and (C2) are cross-sectional OCT images at locations landmarked by two dashed green crosslines (green arrows point to high-scattering necrotic cores). D and E, white-light and GFP images, in which the tumor boundary is marked by dashed white circles; F, a comparison of tumor boundaries detected by five image modalities in vivo. The size of the solid tumor measured by GFP+ fluorescence in vivo was approximately 1.46 mm (panel E) on day 18 after intracranial injection
