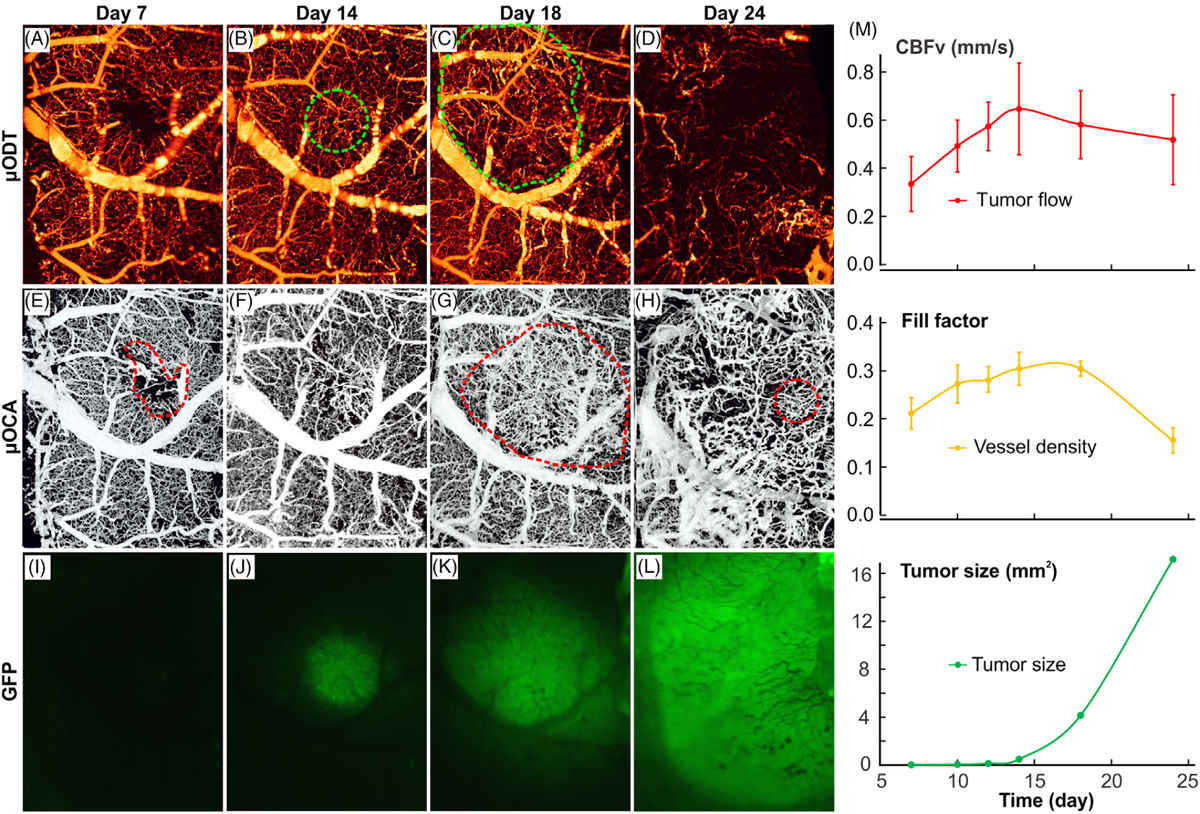
FIGURE 6.

Longitudinal tracking of tumor progression with ultrahigh-resolution optical coherence angiography (μODT)/ultrahigh-resolution optical coherence angiography (μOCA) and fluoresence imaging in vivo. A-D, μODT images of microcirculatory blood flow acquired on day 7, 14, 8 and 24 after tumor cell injection. Dashed green circles point to high capillary flow within the tumor. E-H and I-L, the corresponding μOCA and GFP fluoresence images. Dashed red circles point to either injection spot or dense neoagniogenic vasculature. M, time-course plots of capillary flow (red), capillary density (fill factor; yellow) and tumor proliferation (GFP fluorescence; green)
