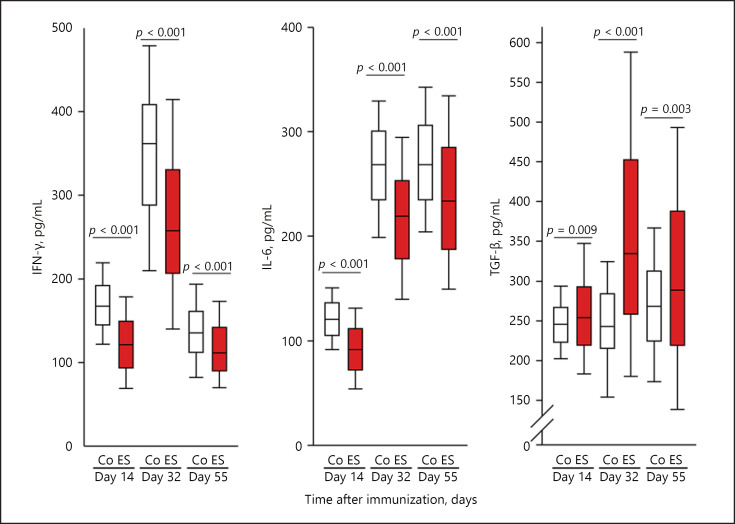
Fig. 2.
Effects of electrically released neurotransmitters on cytokine secretion (IFN-γ, IL-6, and TGF-β). The individual panels show control conditions (Co, white boxes) and conditions under electrical stimulation (ES, red boxes) on days 14, 32, and 55 during arthritis. p values compare groups using Mann-Whitney U test statistics. Data are given as box-plots with the 10th (whisker), 25th, 50th (median), 75th, and 90th (whisker) percentiles. For each condition, at least 25 mice (200 spleen slices) were used.

