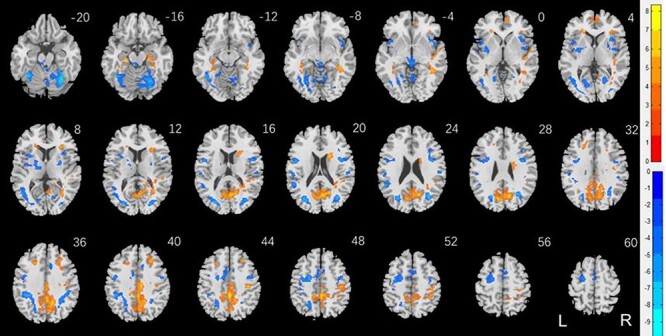
Figure 3 .

Sex differences in regional responses to punishment: two-sample T test of the contrast (punishment-baseline) between men and women with age and years of education as covariates. Voxel P < 0.001, uncorrected. All clusters with cluster P < 0.05, corrected for FWE of multiple comparisons, are shown in Table 3. Color bars showed voxel T values; warm: men > women, cool: women > men. Clusters are overlaid on a T1 structural image in neurological orientation: right = right.
