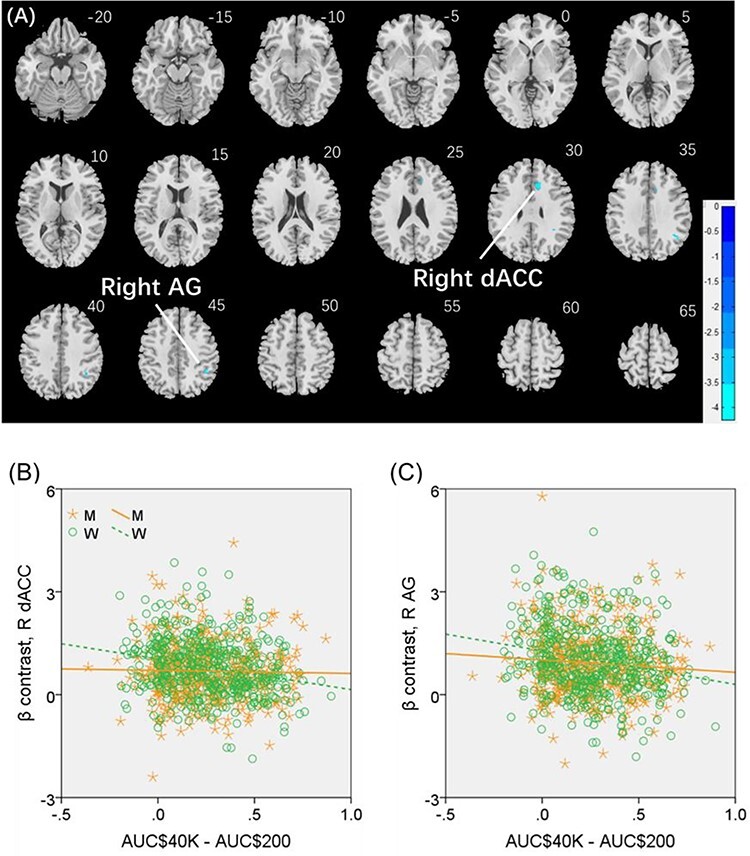
Figure 5 .

(A) Regional responses of reward versus baseline in correlation with “AUC$40K—AUC$200” across women in the R dACC and R AG. (B and C) Region of interest analyses to confirm sex differences in the correlation. Each data point represents 1 subject. Orange/green color: men (M)/women (W). Slope tests show sex differences in the regressions of the R dACC (Z = 3.3, P = 0.001) and R AG (Z = 2.03, P = 0.0424).
