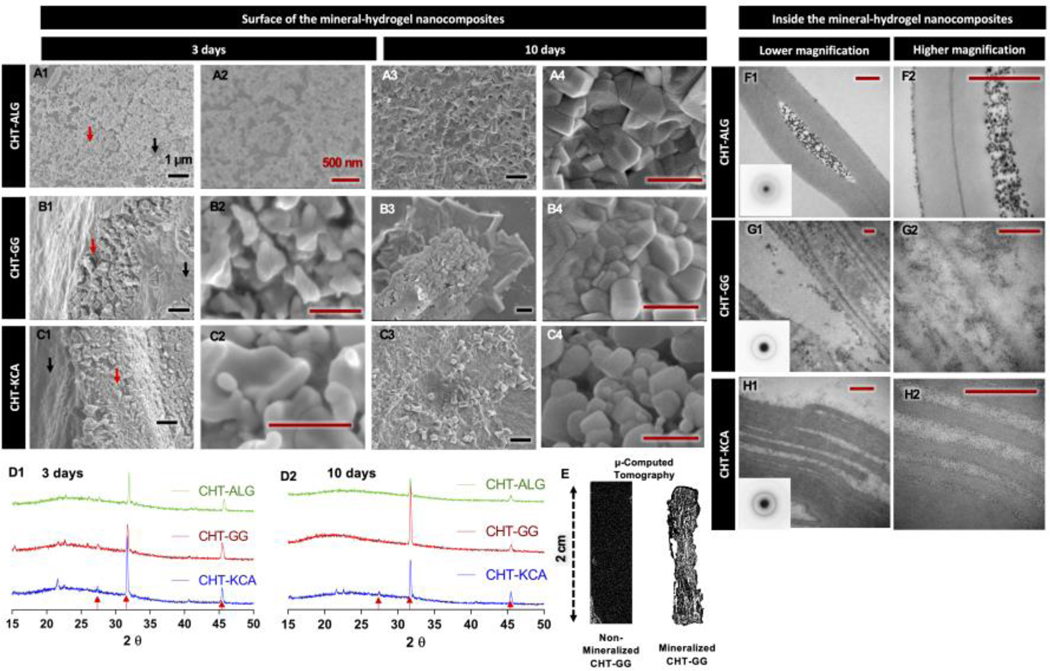
Figure 2: In vitro mineralization and mineral characterization.
(A1-A2, B1-B2 and C1-C2) SEM micrographs of the deposited minerals (red arrow) and hydrogel area without minerals (black arrow) for three-day mineralized CHT-ALG, CHT-GG, and CHT-KCA mineral-hydrogel nanocomposites, respectively; (A3-A4, B3-B4 and C3-C4) SEM micrographs for ten-day mineralized CHT-ALG, CHT-GG, and CHT-KCA mineral-hydrogel nanocomposites, respectively; (F1-F2, G1-G2, and H1-H2) TEM images of transverse sections of three-day mineralized CHT-ALG, CHT-GG, and CHT-KCA mineral-hydrogel nanocomposites, respectively; Inset images in F1, G1, and H1 show selected area electron diffraction patterns of the corresponding mineral-hydrogel nanocomposites type; (D1 and D2) XRD spectra of three-day mineralized and ten-day mineralized mineral-hydrogel nanocomposites, respectively. Red arrows indicate matching peaks with carbonated apatite; (E) A representative three-dimensional micro-CT image of 2 cm x 0.5 cm non-mineralized CHT-GG (left) and ten-day mineralized CHT-GG mineral-hydrogel nanocomposite. Black scale bars indicate 1 μm and red scale bars indicate 500 nm.

