
FIG 2.
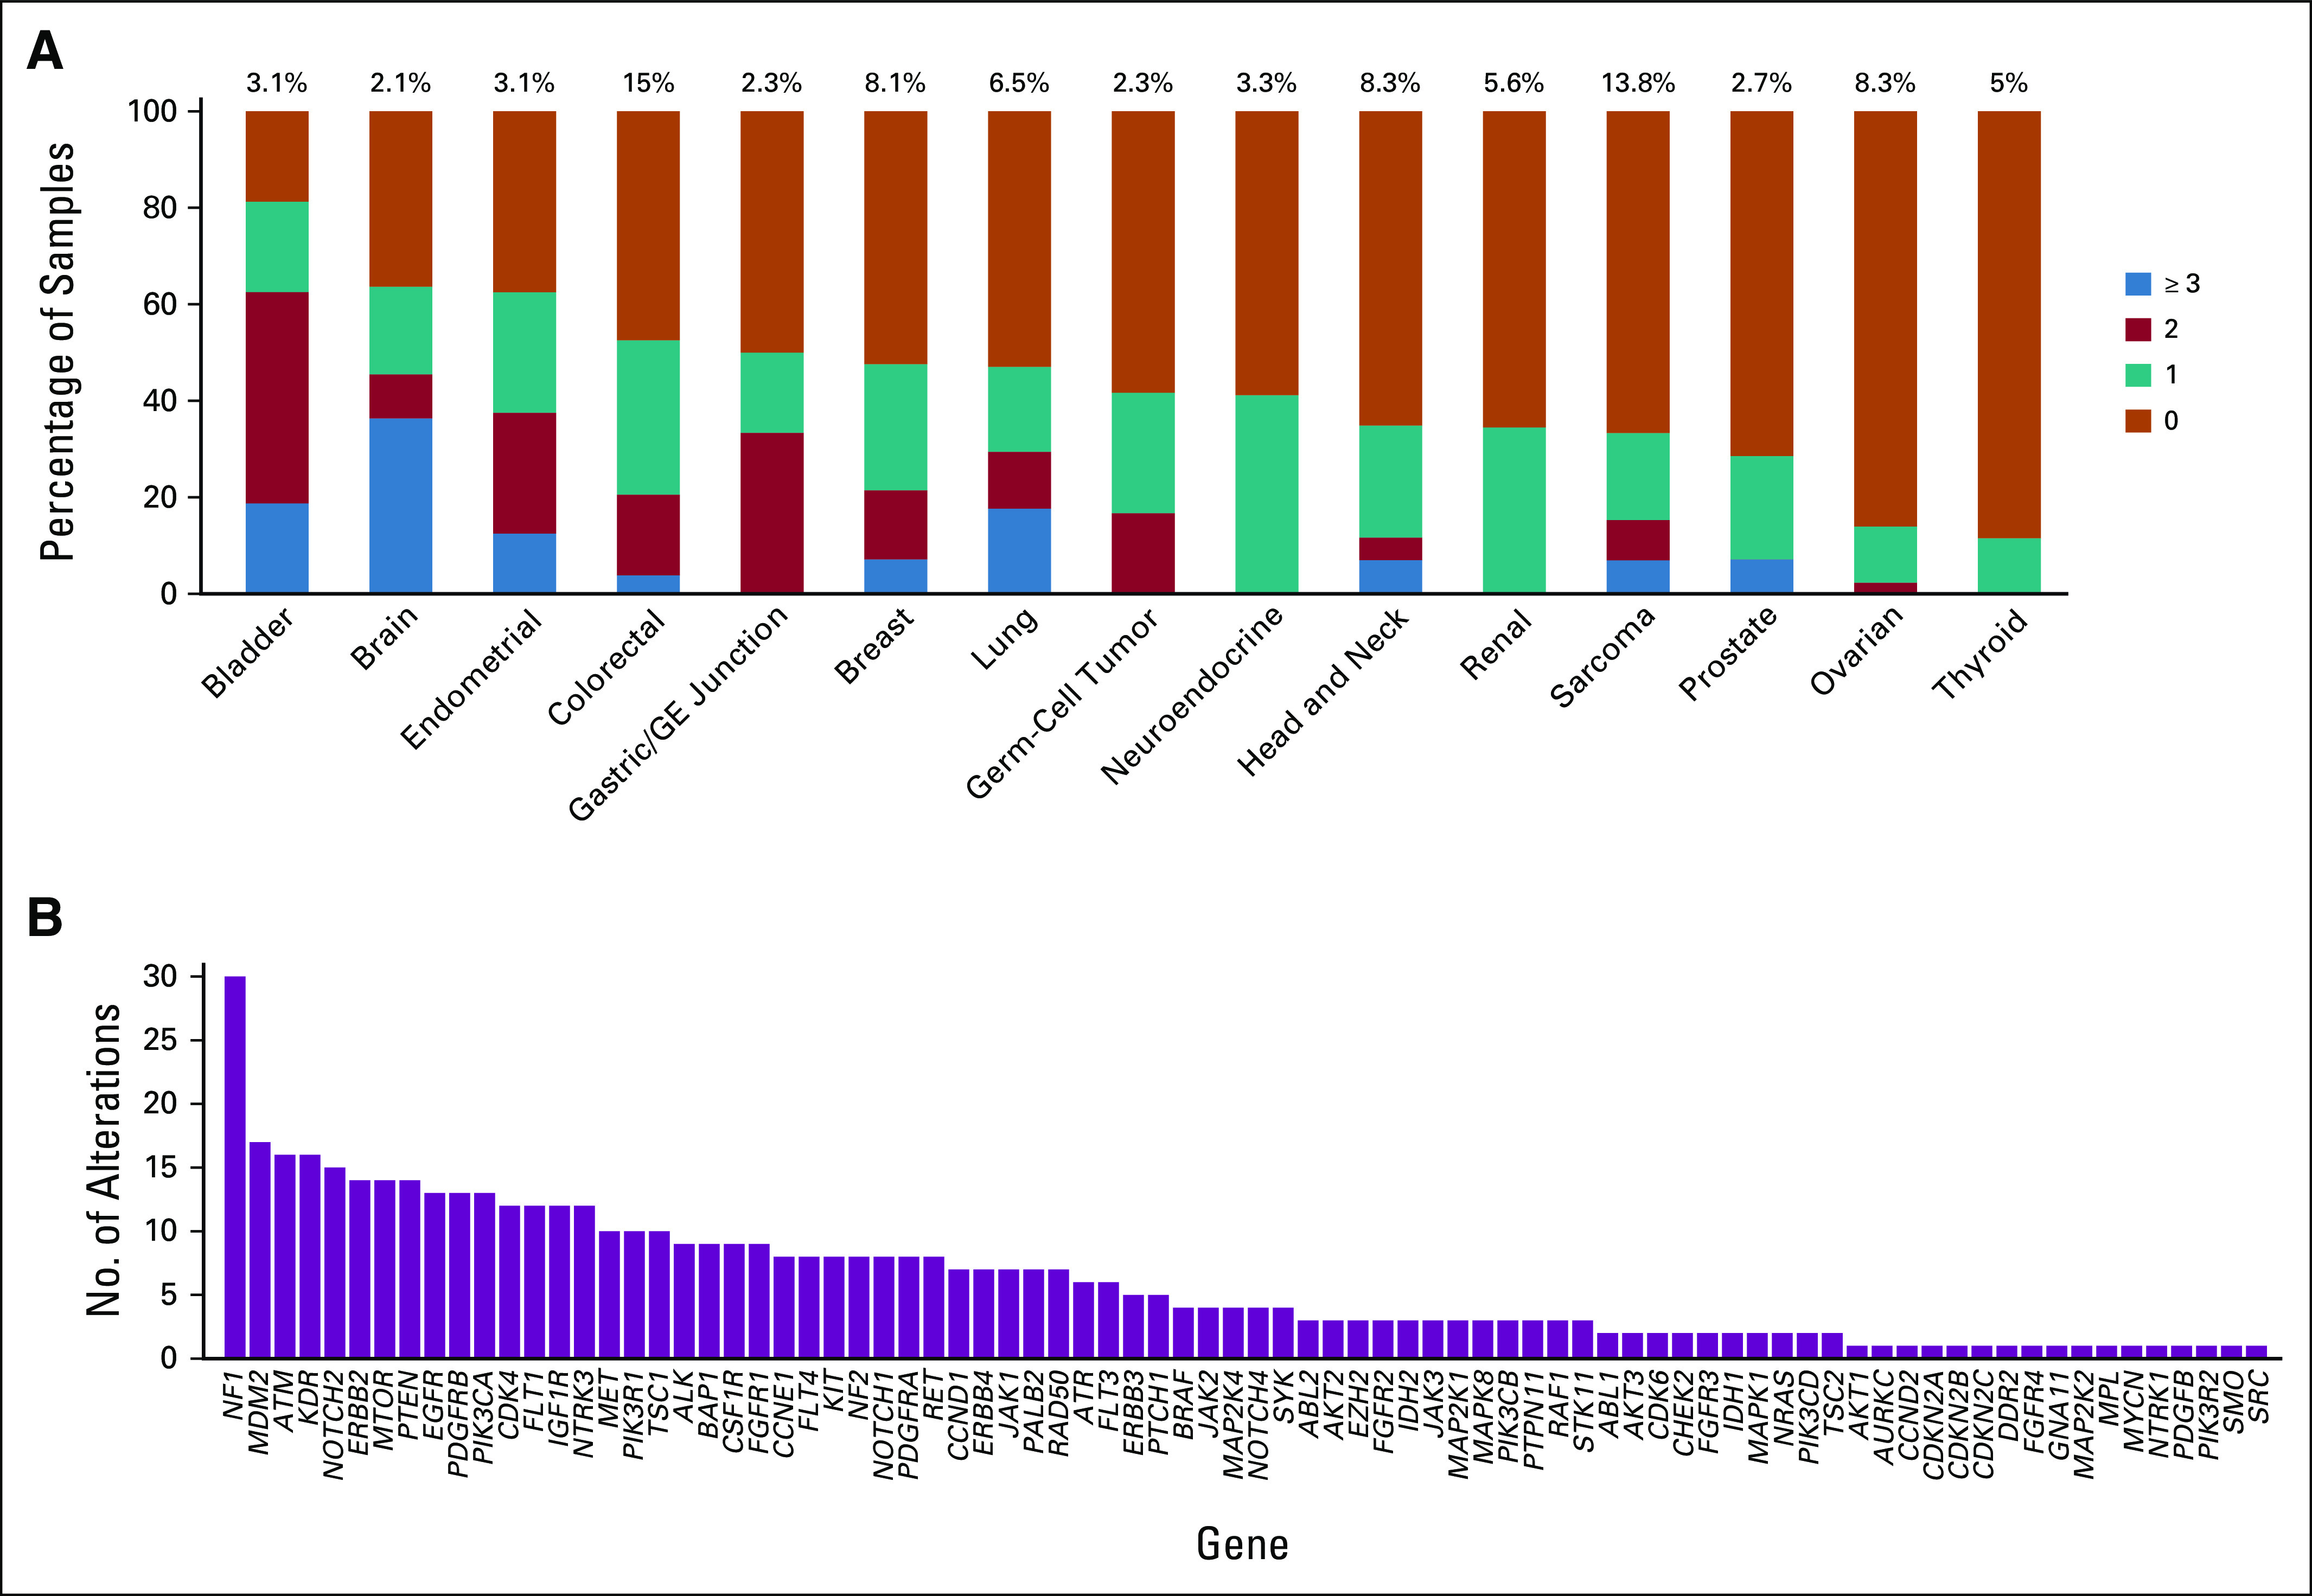
(A and B) Summary of alterations per tumor type (A) and specific genes in which alterations were identified (B). (A) Stacked bar chart shows the percent of cases for each broad class of tumor type listed with 0, 1, 2, or 3 or more alterations in actionable genes not detected in the smaller testing panel. Data are shown for tumor types in which at least 10 patient tumors were sequenced. Total alterations include both mutations and gene amplifications. (B) Alterations were found across a broad spectrum of potentially actionable genes. GE, gastroesophageal.