
FIG 4.
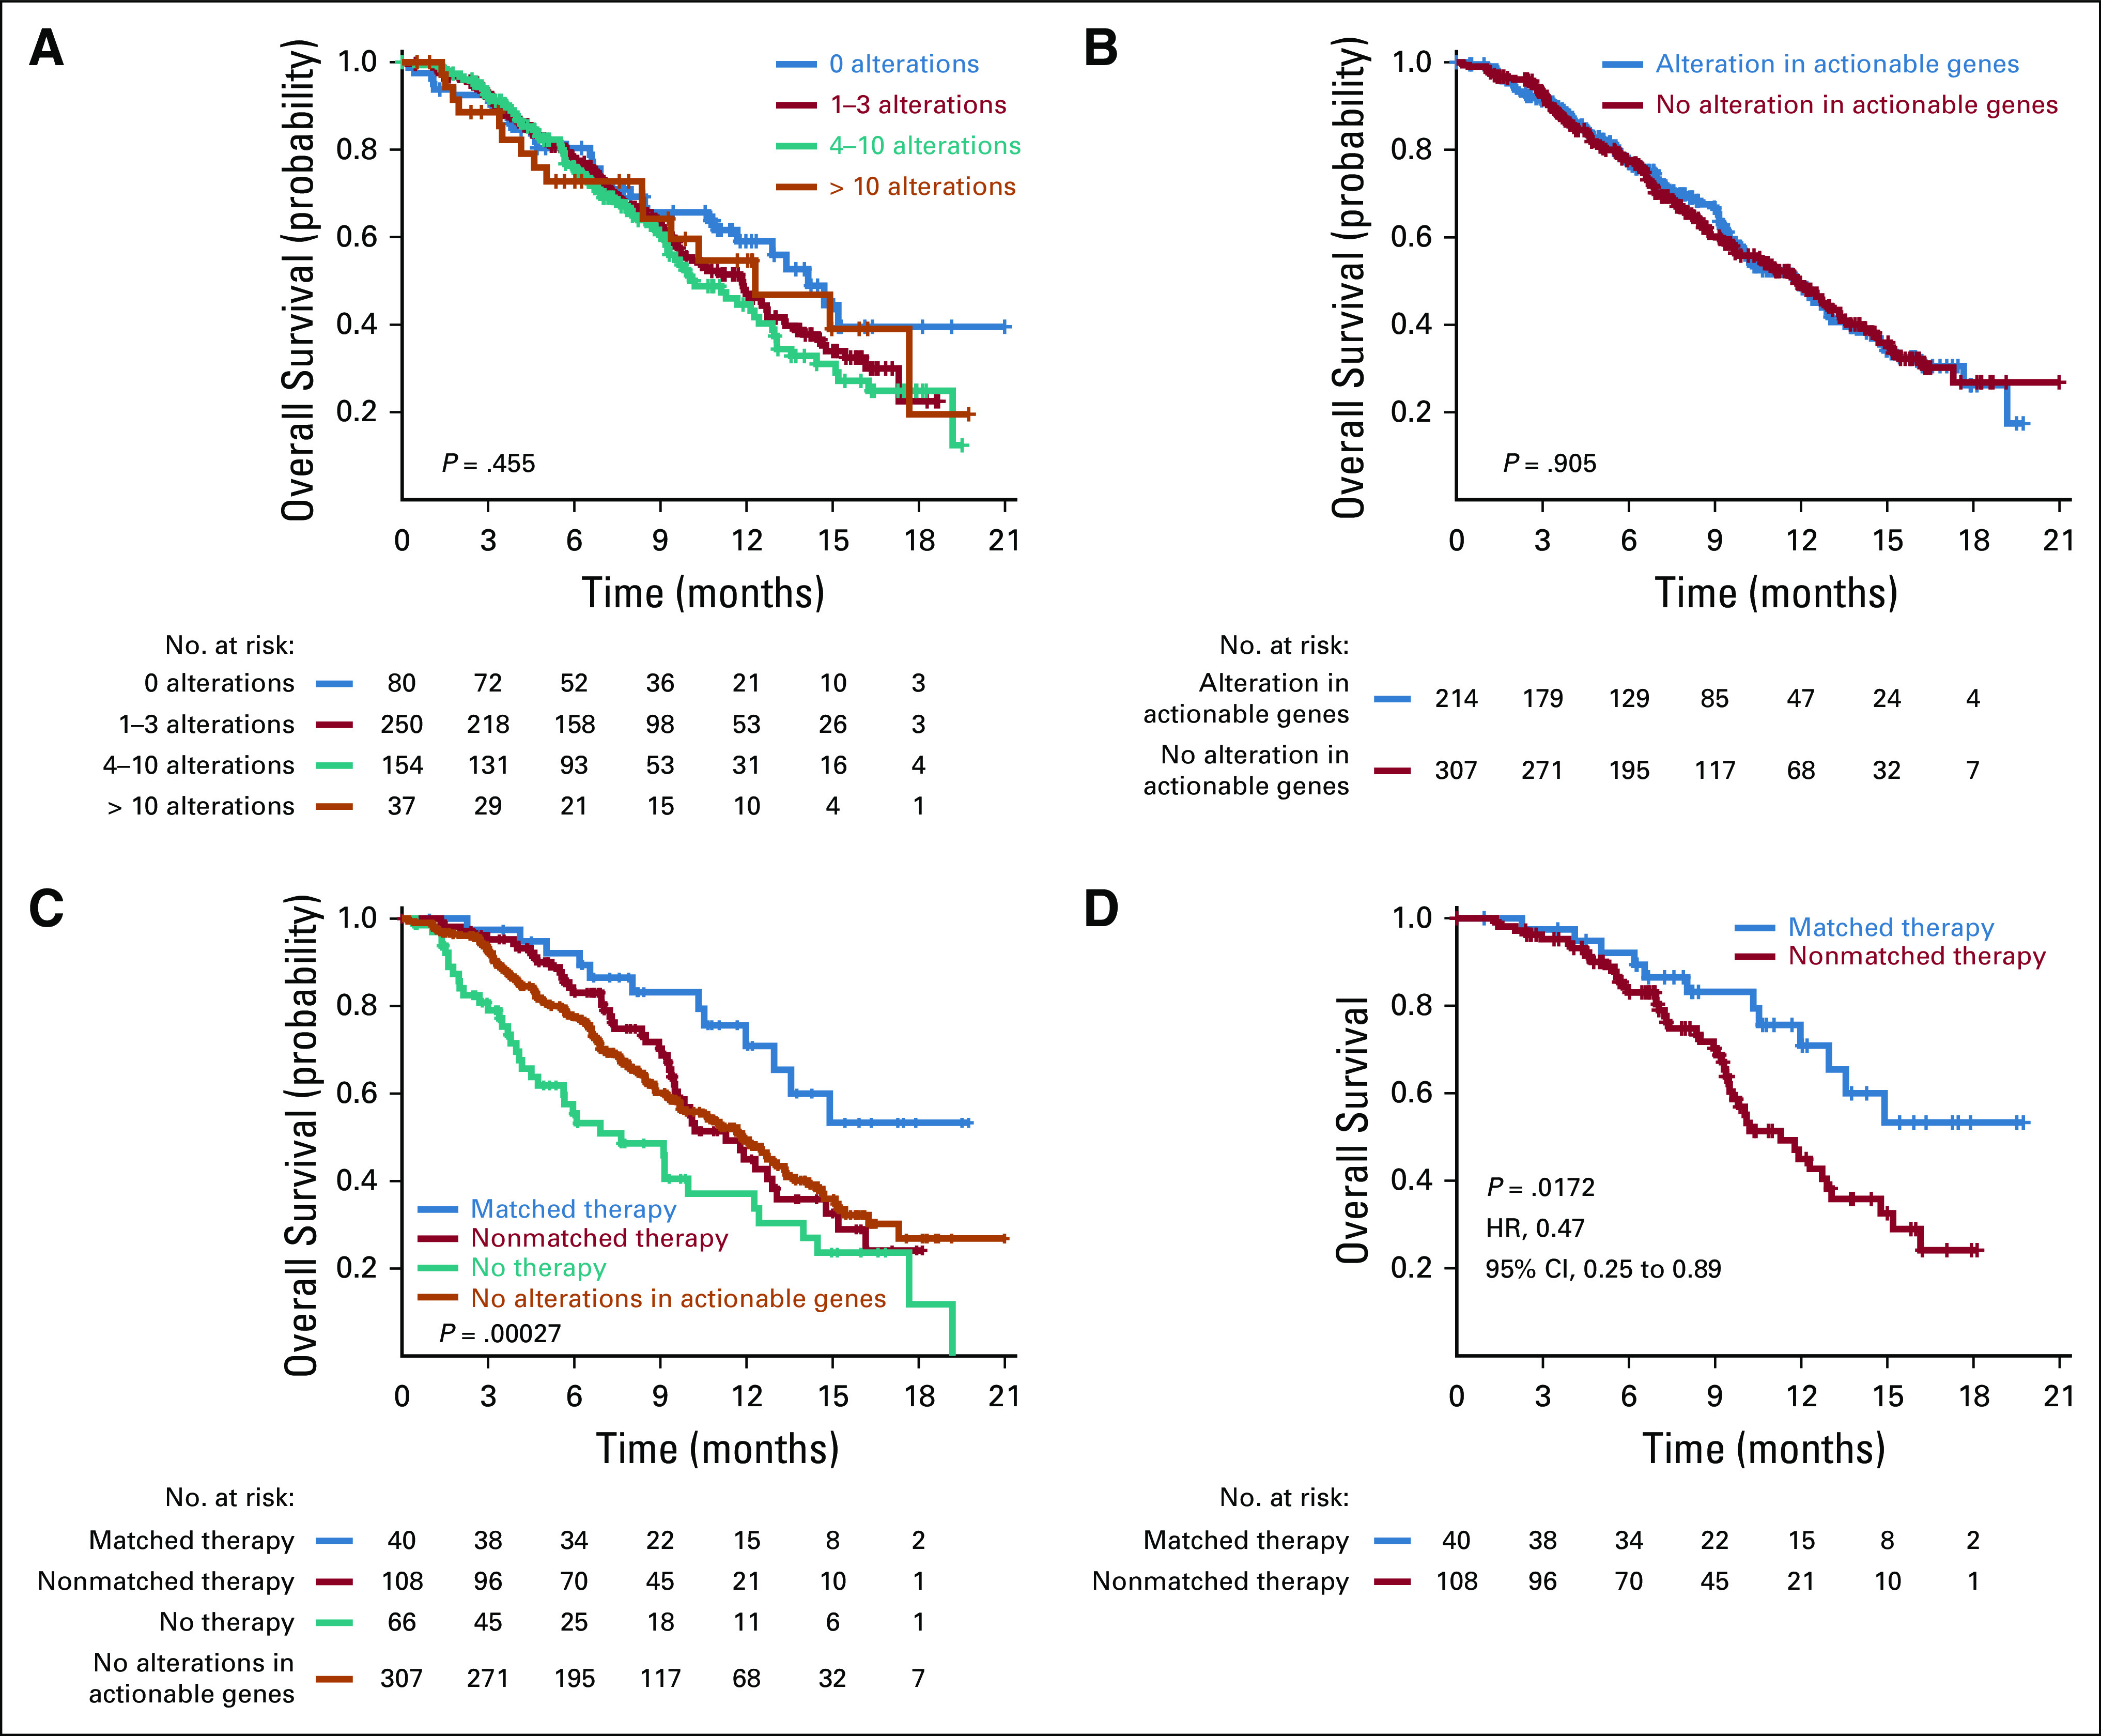
(A-D) Kaplan-Meier plots for overall survival by (A) total number of alterations (actionable and nonactionable) detected, (B) whether the patient had a tumor with an alteration in an actionable gene, (C) type of therapy and absence of alterations in actionable genes, and (D) whether the patient had a tumor with an alteration in an actionable gene on the 409-genes next-generation sequencing panel received matched treatment. Only treatment with matched targeted therapy (C and D) was associated with significantly improved survival (P = .017 compared with patients treated with nonmatched therapy). HR, hazard ratio.