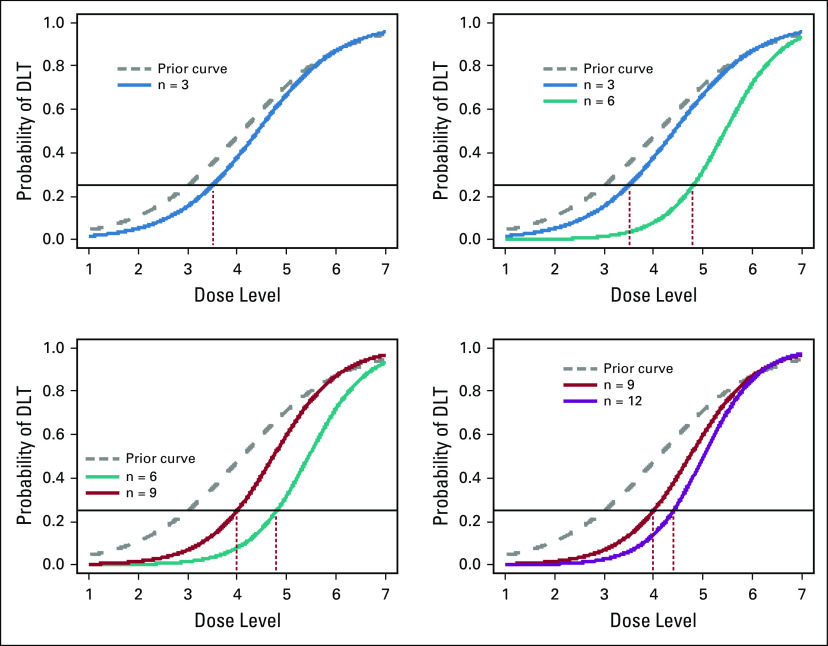
FIG 2.
Example of dose-toxicity curves in the continual reassessment method (CRM) paradigm. The dashed (gray) curves represent the initial curve posited by the investigators. The colored solid curves represent updated curves after the toxicity data from a certain number of patients have been observed. The target dose-limiting toxicity (DLT) rate is assumed to be 25% (horizontal line). The vertical dotted lines point to the optimal dose level to which patients will be assigned.

