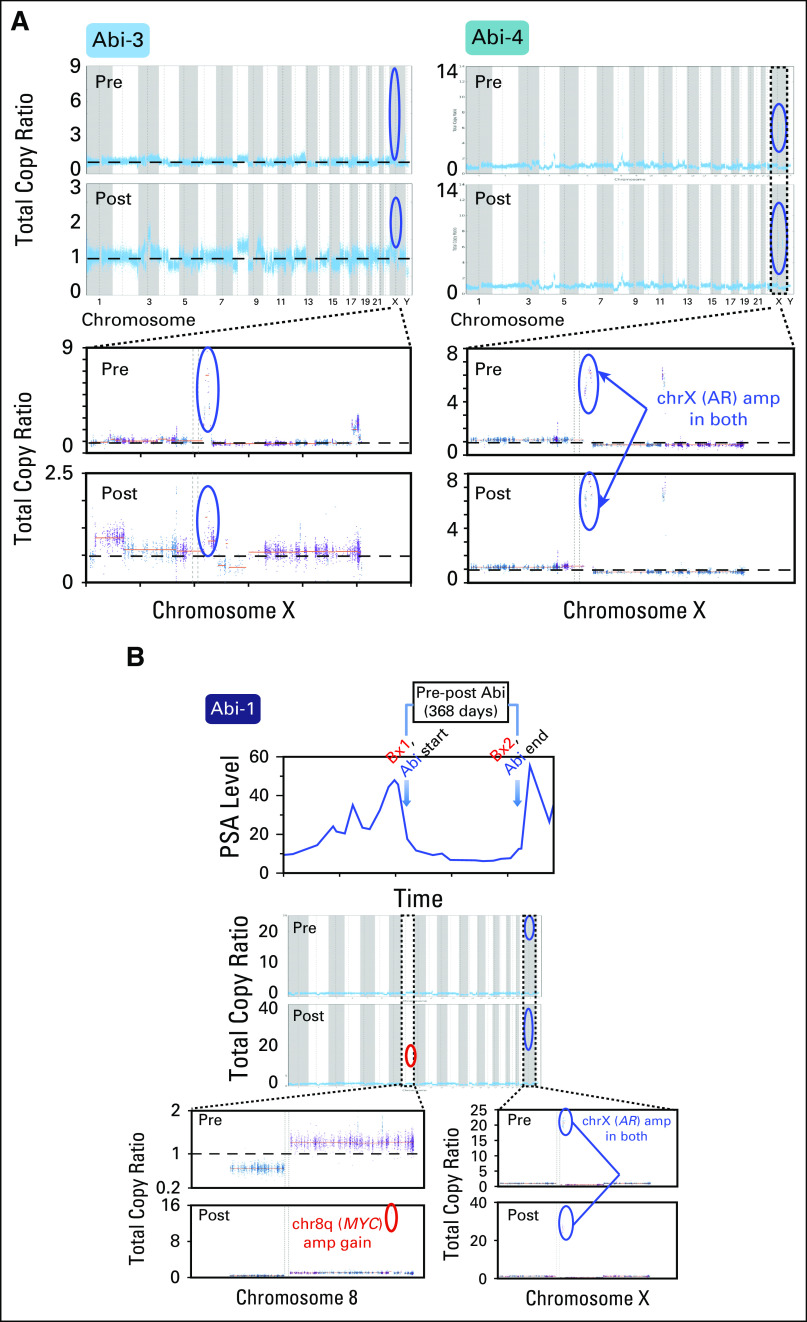
Fig 3.
(A and B) AR, MYC amplification, and abiraterone resistance. Copy number profile of paired samples of patients Abi-1, Abi-3, and Abi-4 across the genome (top) are depicted, and the status of chrX and chr8 is displayed for respective patients (bottom). x-axis coordinates represent positions along the genome; y-axis coordinates represent the total copy ratio. Vertical bars and alternating colors demarcate the borders between chromosomes. Both pre- and post-treatment samples from Abi-3 and Abi-4 harbored AR amplifications, whereas samples from Abi-1 harbored pre-existing AR amplification but obtained a focal gain of MYC in the resistant sample. Focally amplified regions are encircled for AR (blue) and MYC (red). For Abi-1, prostate-specific antigen (PSA) level and duration of treatment are depicted.

