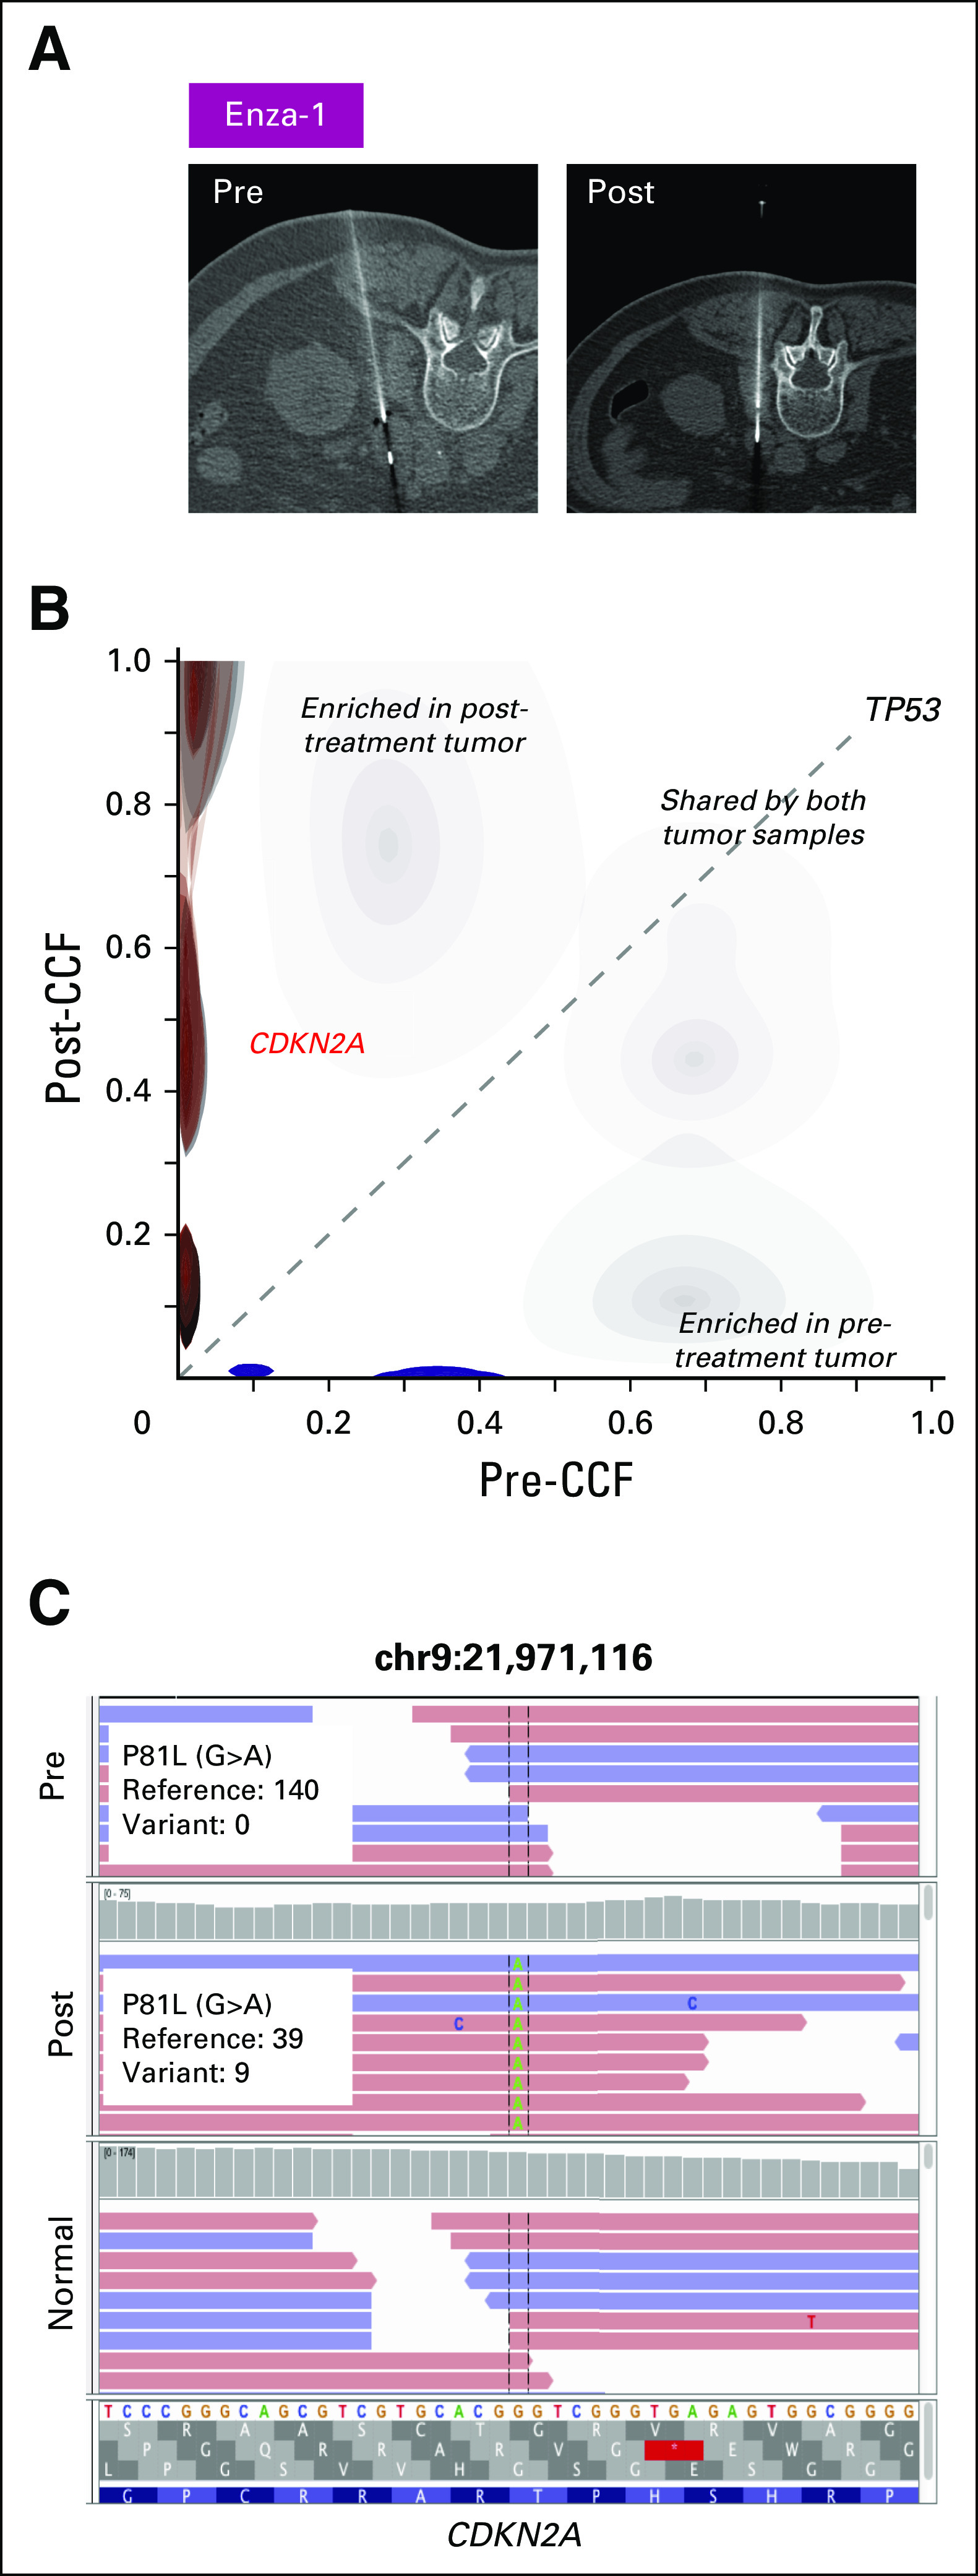
Fig 4.

Mutation and amplification in cell-cycle pathway genes correlate with resistance to enzalutamide. (A) Computed tomography scans of the left retroperitoneal region taken before treatment and after resistance to therapy in patient Enza-1. Note the shrinkage in tumor mass after enzalutamide treatment. White line represents the needle used to withdraw tumor tissue. (B) In patient Enza-1, the fraction of mutations unique to the pretreatment and post-treatment states are shown in blue and red, respectively. Cancer cell fractions (CCF) for mutations in the pretreatment (x-axis) and post-treatment (y-axis) tumors are compared. Selected cancer genes are annotated in the CCF plots. (C) P81L mutation of CDKN2A, found only in the post-treatment tumor, is visualized in the Integrated Genomics Viewer (IGV) browser. The genomic position is shown at the top of the IGV panel. The variant nucleotide is positioned in the middle. From top to bottom are shown sequencing reads in pretreatment tumor, post-treatment tumor, and germline samples. Colored letters indicate differences from the reference sequence. Change of nucleotide, amino acid, and number of reads in reference and variant alleles are shown in the box.
