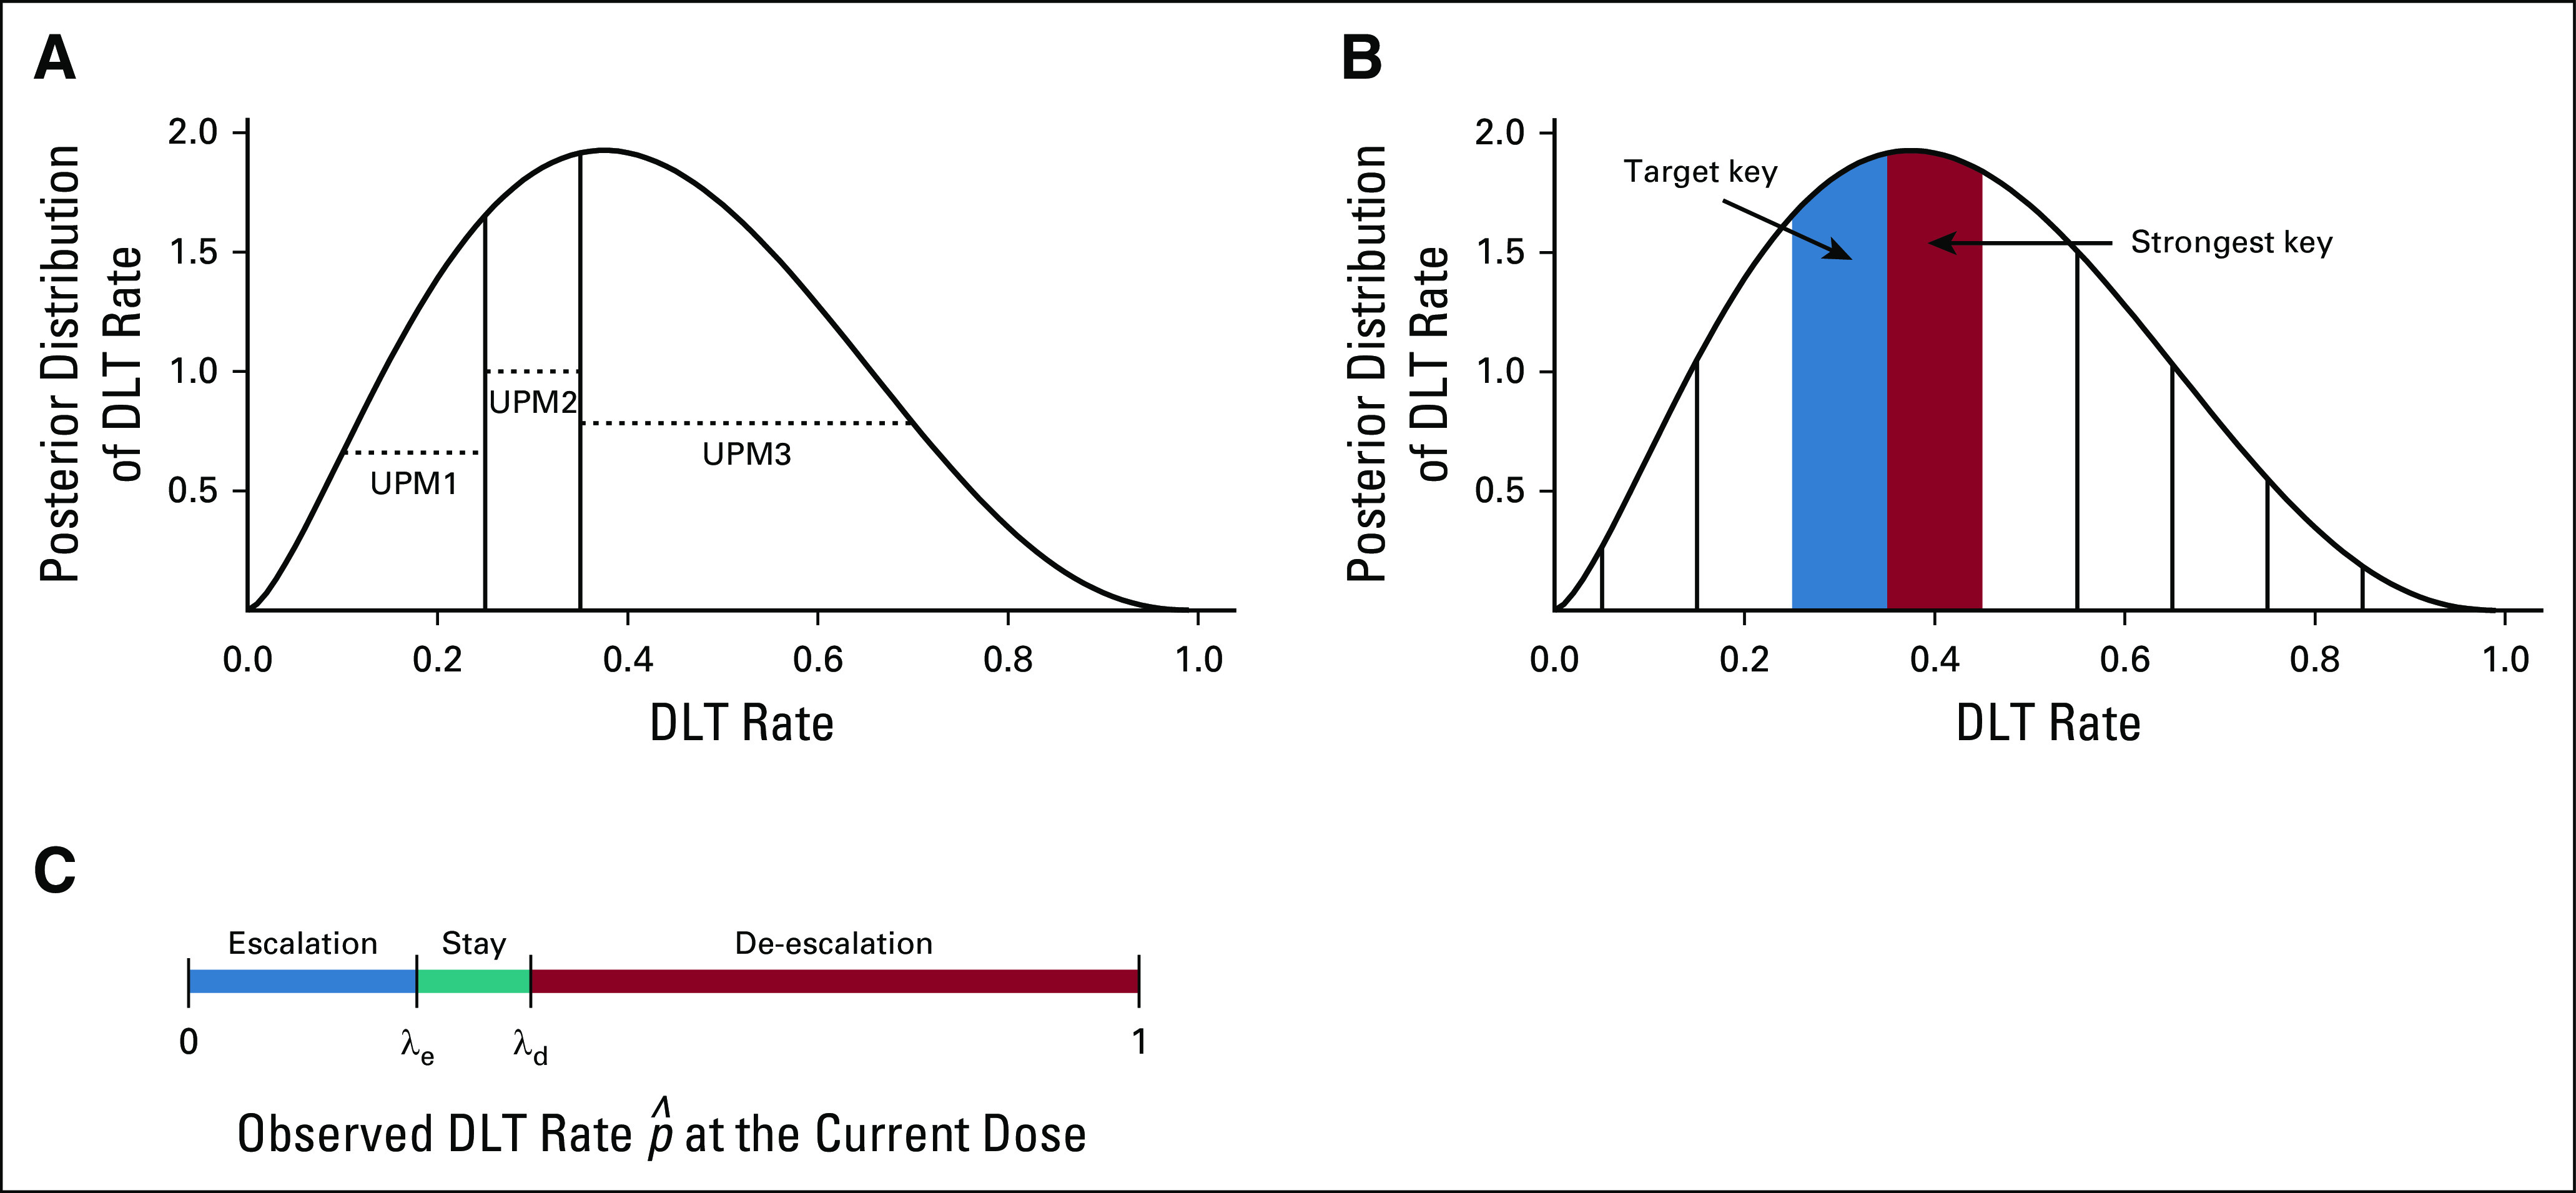
FIG 1.

Illustration of the (A) modified toxicity probability interval, (B) keyboard, and (C) Bayesian optimal interval designs. The curves in (A) and (B) are the posterior distributions of the dose-limiting toxicity (DLT) probability at the current dose. To determine the next dose, the modified toxicity probability interval design calculates and compares the values of the three unit probability masses (UPMs), whereas the keyboard design compares the location of the strongest key with respect to the target key. Bayesian optimal interval compares the observed DLT rate at the current dose with the optimized dose escalation boundary, λe, and de-escalation boundary, λd.
