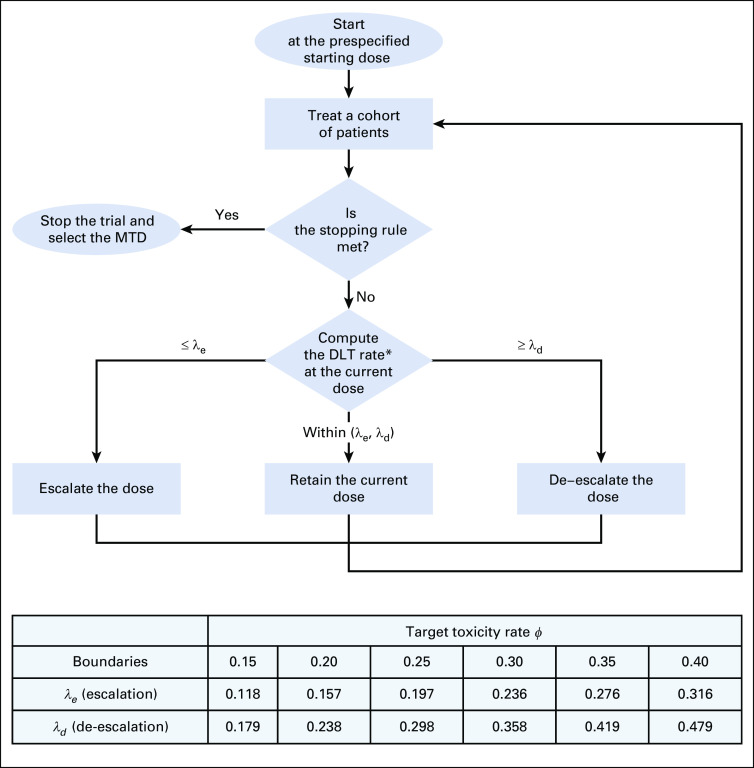
FIG 2.
The flowchart of the Bayesian optimal interval design in which λe and λd are the dose escalation boundary and the de-escalation boundary, respectively. (*) DLT rate = total number of patients who experienced DLT at the current dose divided by the total number of patients treated at the current dose. MTD, maximum-tolerated dose.

