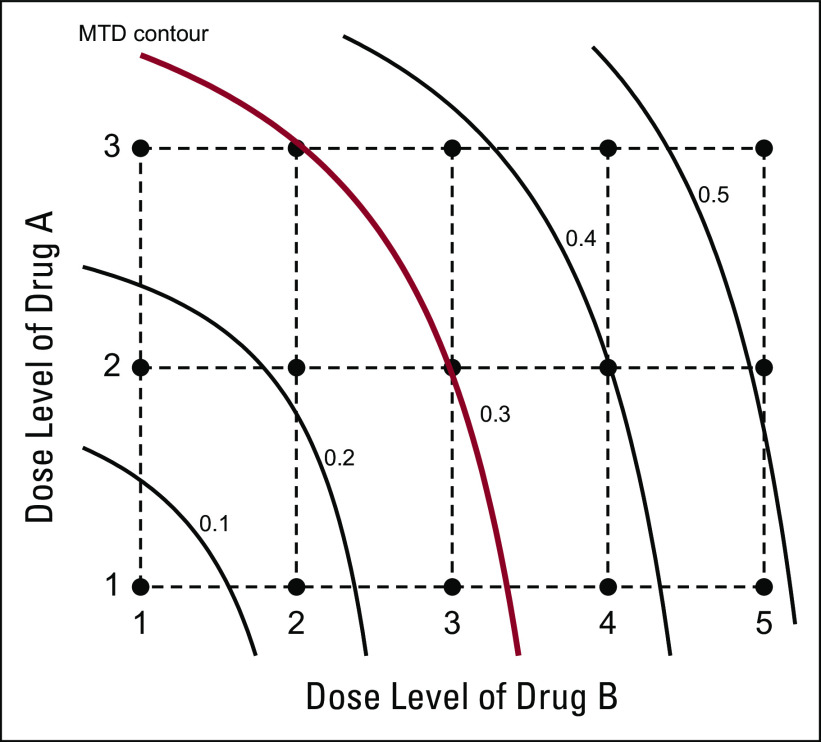
Fig A1.
Maximum-tolerated dose (MTD) contour in drug combination trials. Curved lines indicated the toxicity contours with true toxicity rates of 0.1, 0.2, 0.3, 0.4, and 0.5, respectively. Combinations located along the rows and columns are ordered in toxicity, but, in other directions of the dose matrix (eg, along the diagonals from the upper left corner to the lower right corner), the toxicity order is unknown because of unknown drug-drug interactions.

