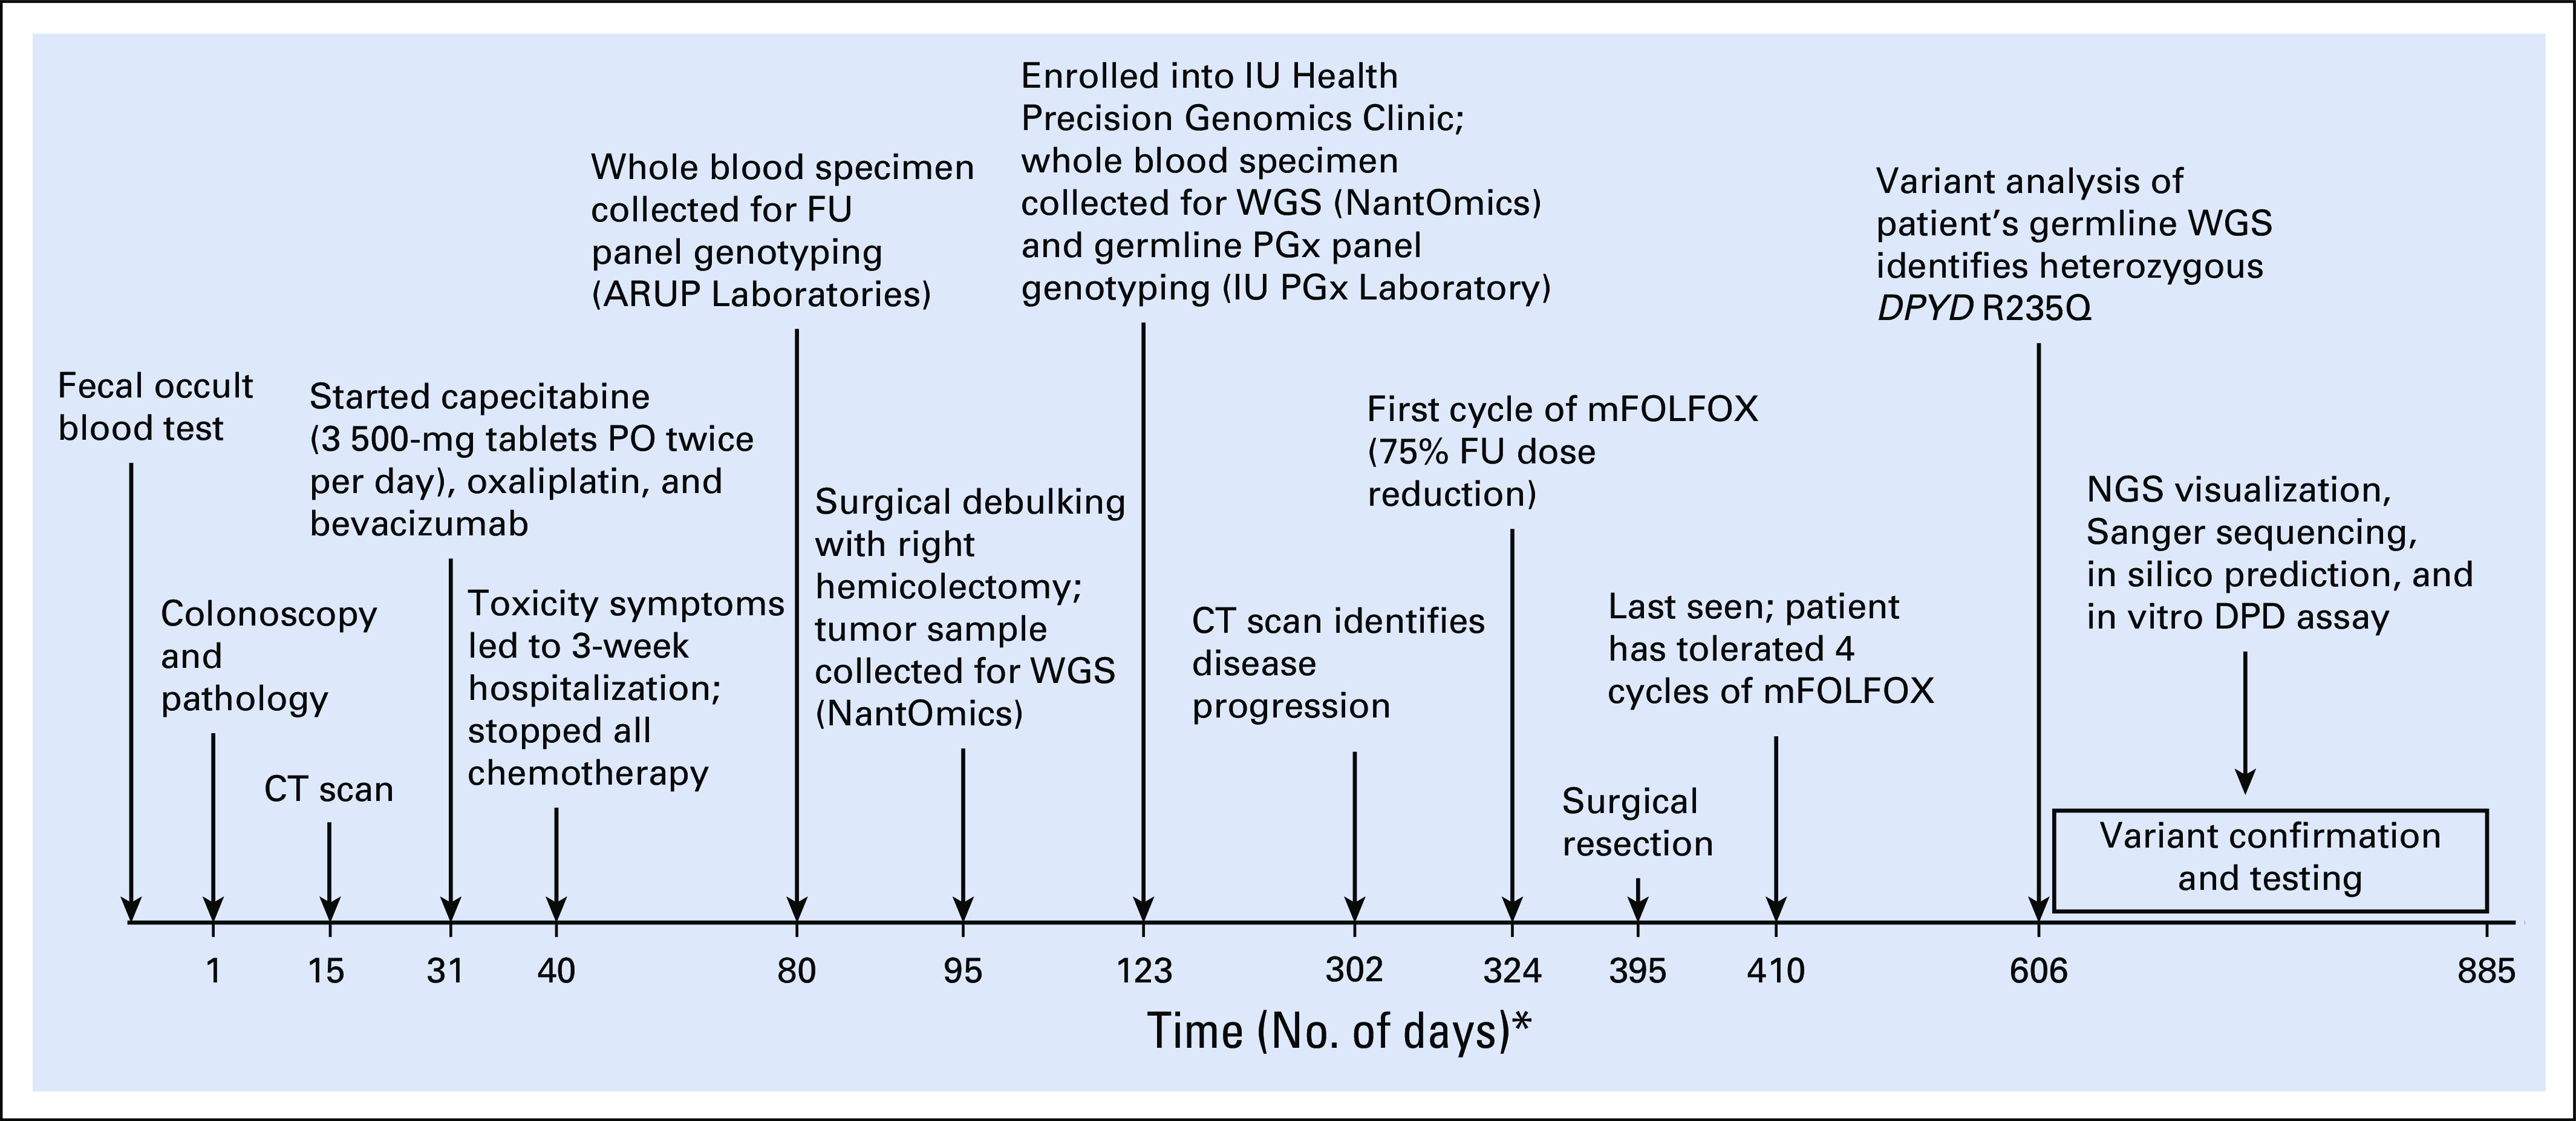
FIG 1.

Time line of patient’s case report. This diagram shows the time line of key events in the diagnosis, treatment, and laboratory testing of DPYD variants. The horizontal line represents the number of days from initial diagnosis to the patient’s last encounter after modified infusional fluorouracil, leucovorin, and oxaliplatin (mFOLFOX) treatment. (*) Not drawn to scale. CT, computed tomography; DPD, dihydropyrimidine dehydrogenase; FU, fluorouracil; IU, Indiana University; NGS, next-generation sequencing; PGx, pharmacogenomics; PO, oral; WGS, whole-genome sequencing.
