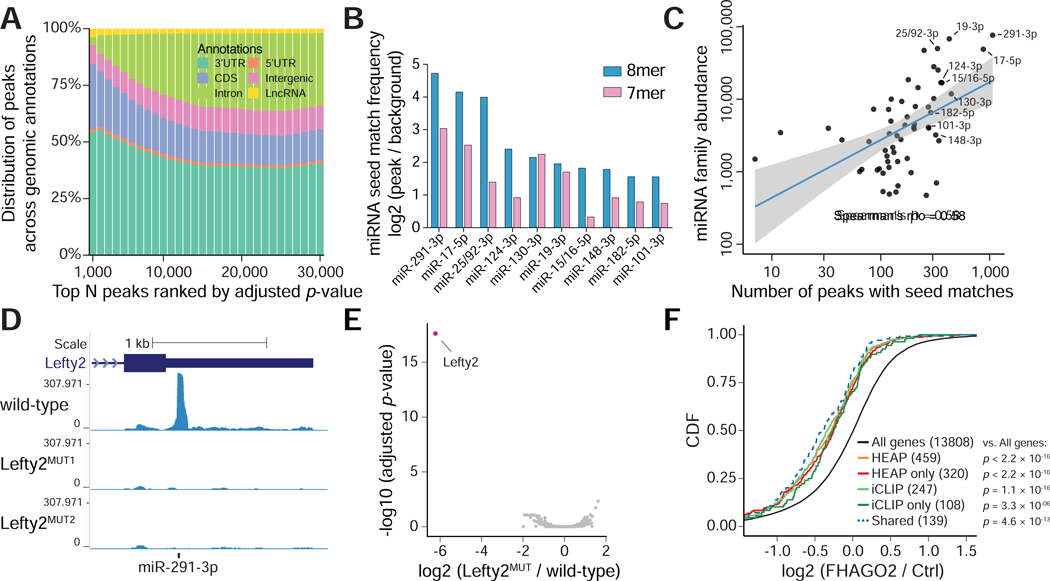
Figure 2. Mapping Halo-Ago2 binding sites in mESCs.
A) Peaks identified in the HEAP libraries from mESCs were ranked by increasing adjusted p-value before calculating their distribution across genomic annotations. CDS: coding sequence; 5’UTR: 5’untranslated region; 3’UTR: 3’-untranslated region; LncRNA: long non-coding RNA. B) Enrichment for sequences complementary to murine miRNA seeds (7mers and 8mers) was calculated comparing 3’UTR sequences within and outside HEAP peaks. The bar plot shows enrichment for the top ten miRNA seed families ranked by 8mer enrichment scores. C) Scatter plot showing the correlation between number of 3’UTR peaks with 7mer or 8mer seed matches to individual miRNA families and abundance of their corresponding miRNAs as measured in HEAP miRNA libraries. Blue line: best fit linear regression, with 95% confidence interval in grey. D) Genome browser view of the Lefty2 3’UTR with tracks corresponding to libraries generated from wild-type mESC or cells harboring targeted mutations disrupting the predicted miR-291–3p binding site (Lefty2MUT1, Lefty2MUT2). E) Volcano plot of global changes in HEAP peak intensity between the Lefty2MUT and wild-type mESC libraries. Notice the selective loss of the Lefty2 3’UTR binding site (highlighted). F) Cumulative distribution function (CDF) plot for targets of miR-291–3p identified by iCLIP or HEAP. The log2 fold change was calculated in Ago1–4−/− mESCs upon ectopic FHAGO2 expression. HEAP only: targets identified uniquely by HEAP; iCLIP only: targets identified uniquely by iCLIP; shared: targets identified by both methods. P-value: two-sided Kolmogorov–Smirnov test.
See also Figure S1C–I, S2. See Data S2 for peaks identified in mESCs.

