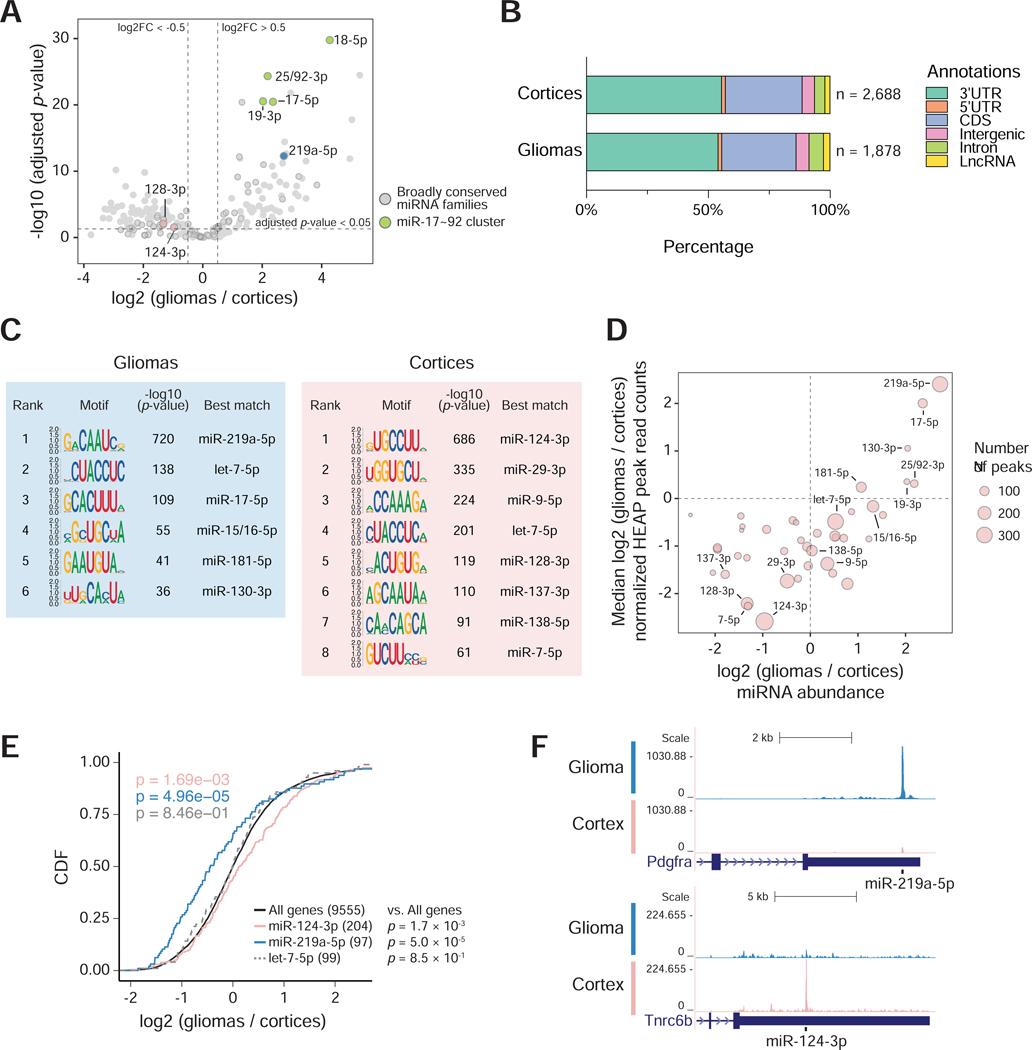
Figure 4. Mapping miRNA-target interactions in normal brain and brain tumors.
A) Volcano plot of global changes in miRNA family expression between normal cortices and BcanNtrk1-driven gliomas, as determined by HEAP. Broadly conserved families are highlighted in circles and a few miRNA families of interest are colored and annotated. B) Total number and distribution across genomic annotations of peaks identified in the cortex and glioma HEAP libraries at adjusted p-value < 0.05. C) Top differentially enriched 8-mers in glioma and cortex HEAP peaks (peak selection cutoff: adjusted p-value < 0.05; absolute log2 (gliomas / cortices) > 0.5) by the HOMER de novo motif discovery algorithm. miRNA families whose seed sequences are complementary to these motifs are annotated. D) Changes in peak intensity correlate with changes in miRNA abundance. The area of each circle is proportional to the number of targets of each miRNA seed family as identified by HEAP. Only broadly conserved miRNA families with more than 40 HEAP targets are shown. E) Cumulative distribution function (CDF) plot for targets of miR-124–3p, miR-219a-5p and let-7–5p identified by HEAP. mRNA expression was estimated using read counts in input control libraries. The mRNA log2 fold change was calculated as gliomas vs. cortices. P-value: two-sided Kolmogorov–Smirnov test. F) Genome browser view of representative Halo-Ago2 binding sites detected exclusively in gliomas (top) or cortices (bottom).
See also Figure S5A. See Data S2 for peaks identified in gliomas and cortices.

