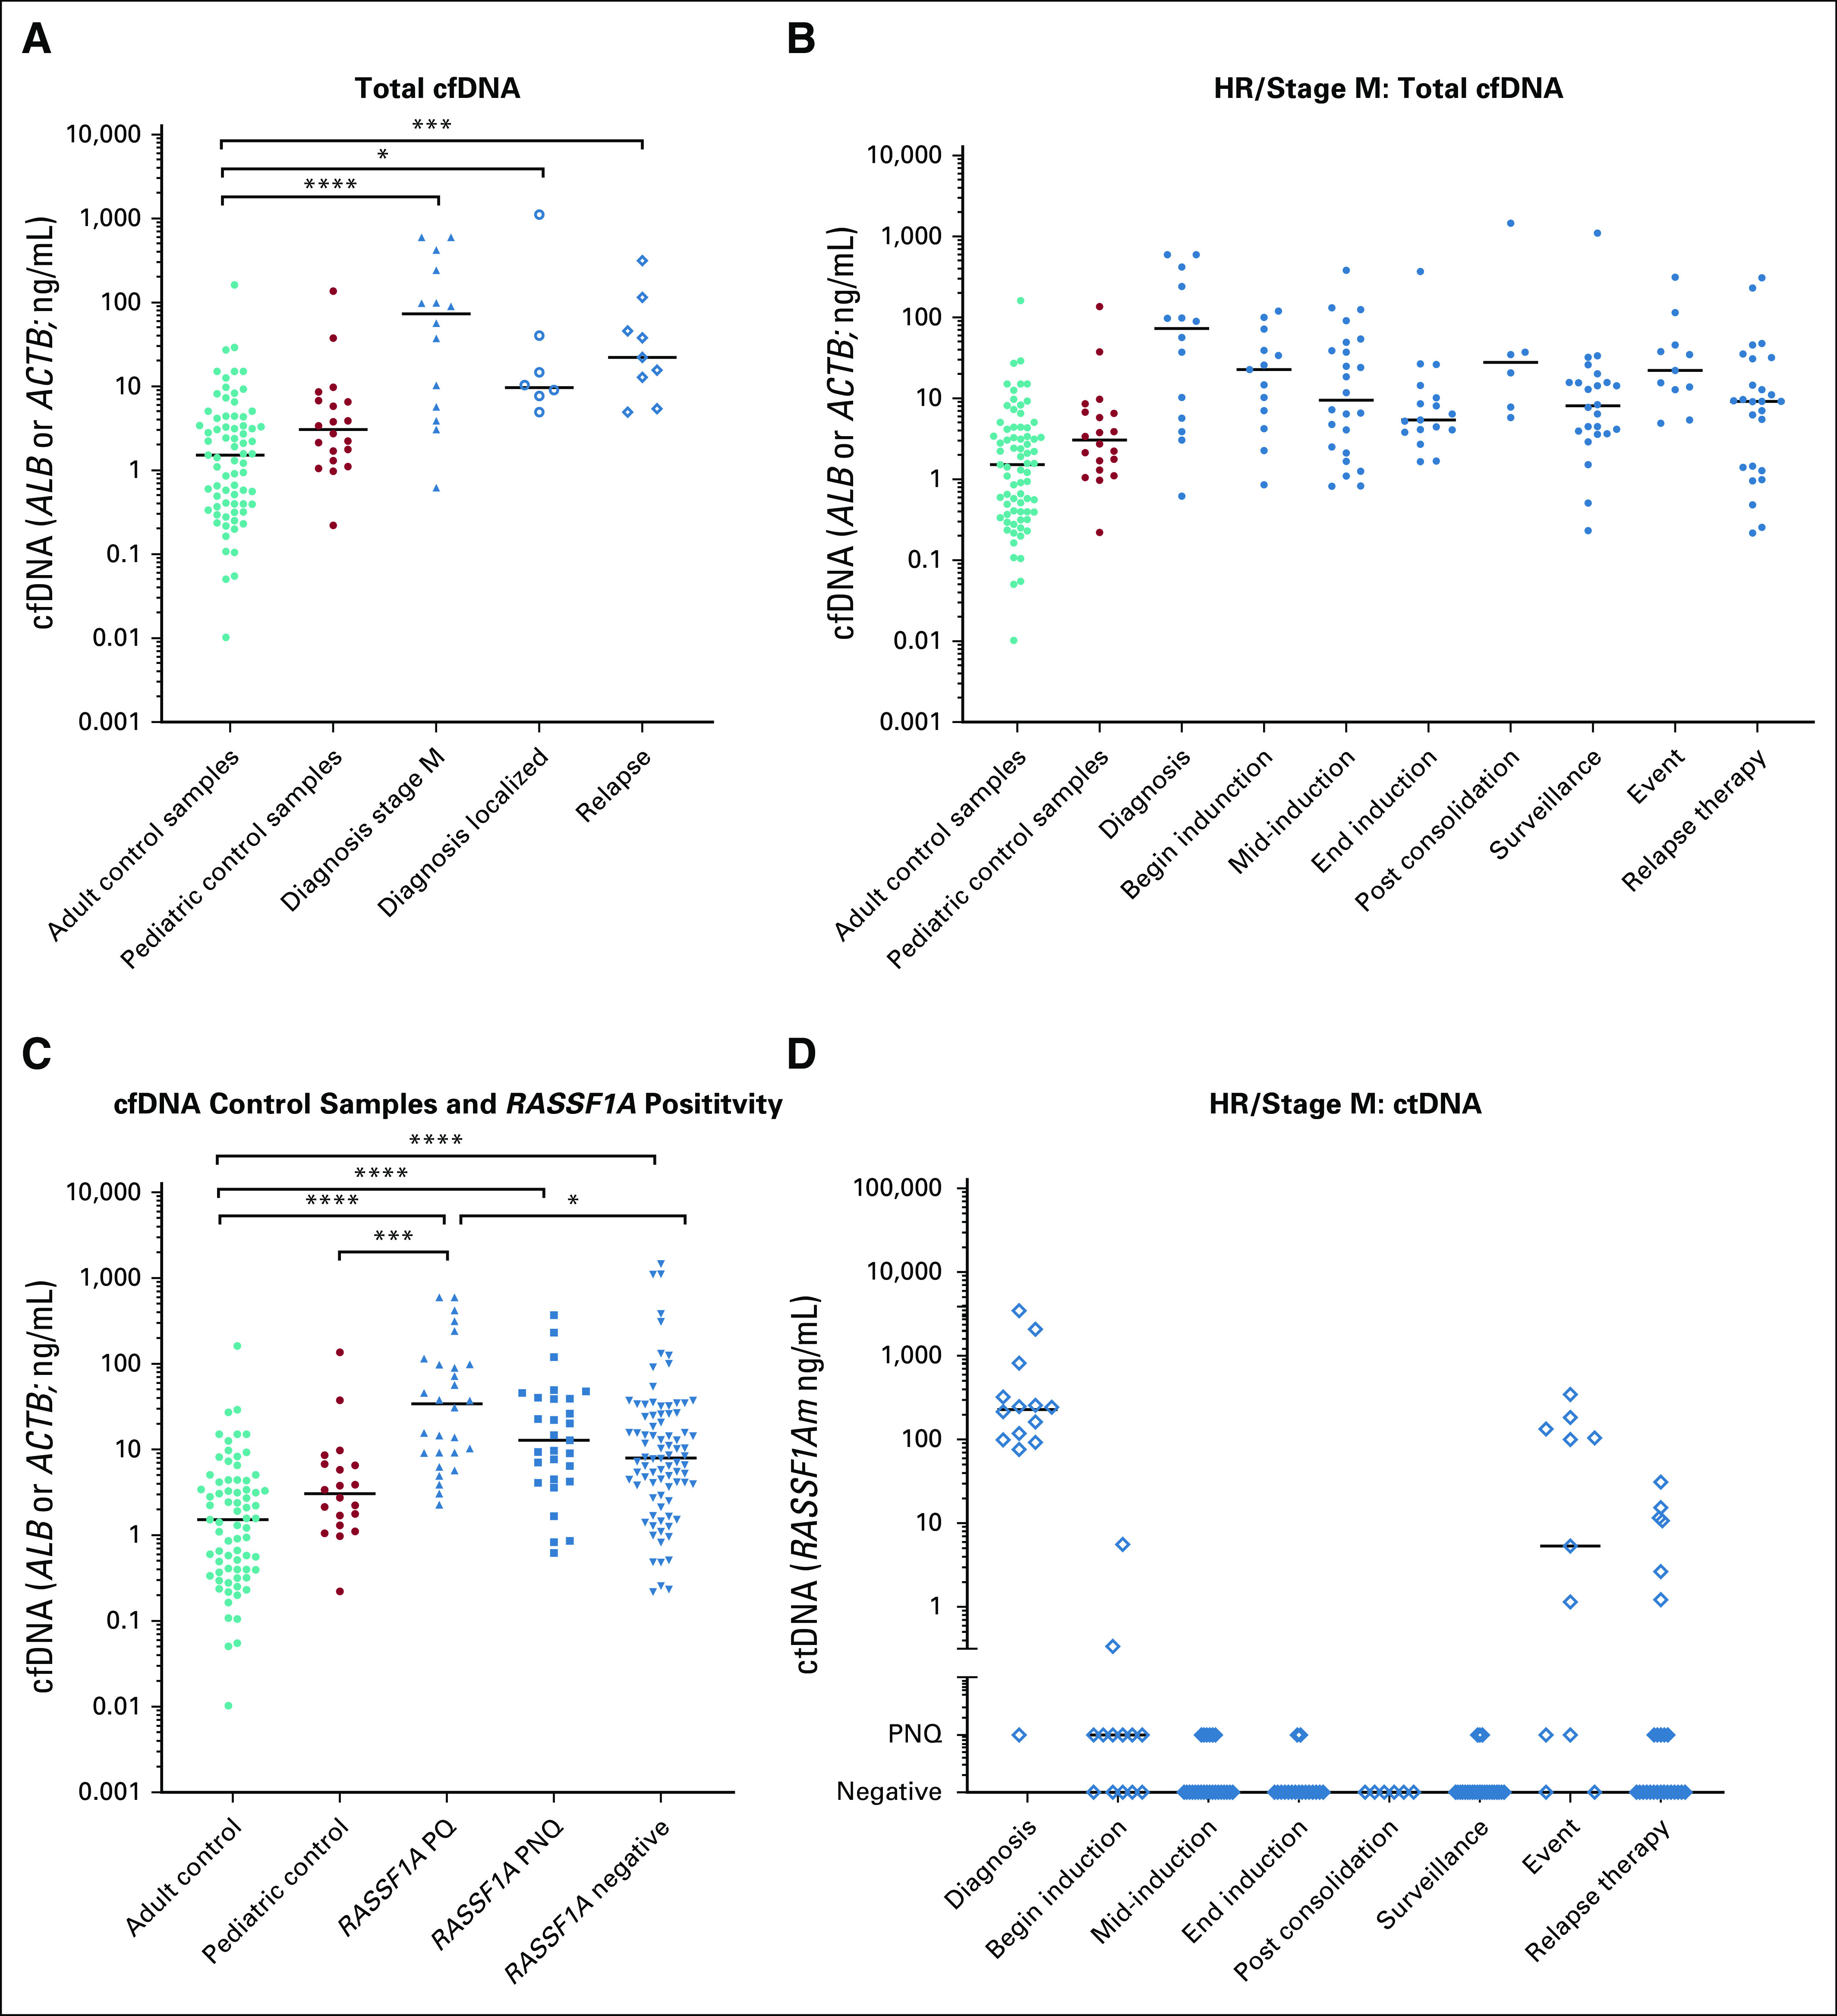
FIG 2.

Amount of cell free DNA (cfDNA) and circulating tumor DNA (ctDNA). (A) Comparison of amount cfDNA (measured by albumin [ALB] or β-actin [ACTB]) between patients with neuroblastoma and healthy control donors. (B) Amount of cfDNA (measured by ALB or ACTB) at different time points during treatment. (C) Amount of cfDNA in samples with ctDNA compared with samples from healthy control donors and samples without ctDNA detected. (D) Amount of ctDNA (measured by hypermethylated RASSF1A [RASSF1Am]) at different time points during treatment. Begin induction indicates until 2 courses of induction therapy; mid-induction indicates after 3-5 courses of induction chemotherapy, unless additional courses were given after 6 courses, and samples before last course were also included at this time point; end induction indicates at the end of induction therapy; surveillance indicates during follow-up or at relapse suspicion; and event indicates relapse or progression. HR, high risk; PNQ, positive not quantifiable; PQ, positive and quantified. (*) P < .05, (**) P < .01, (***) P < .001, (****) P < .0001.
