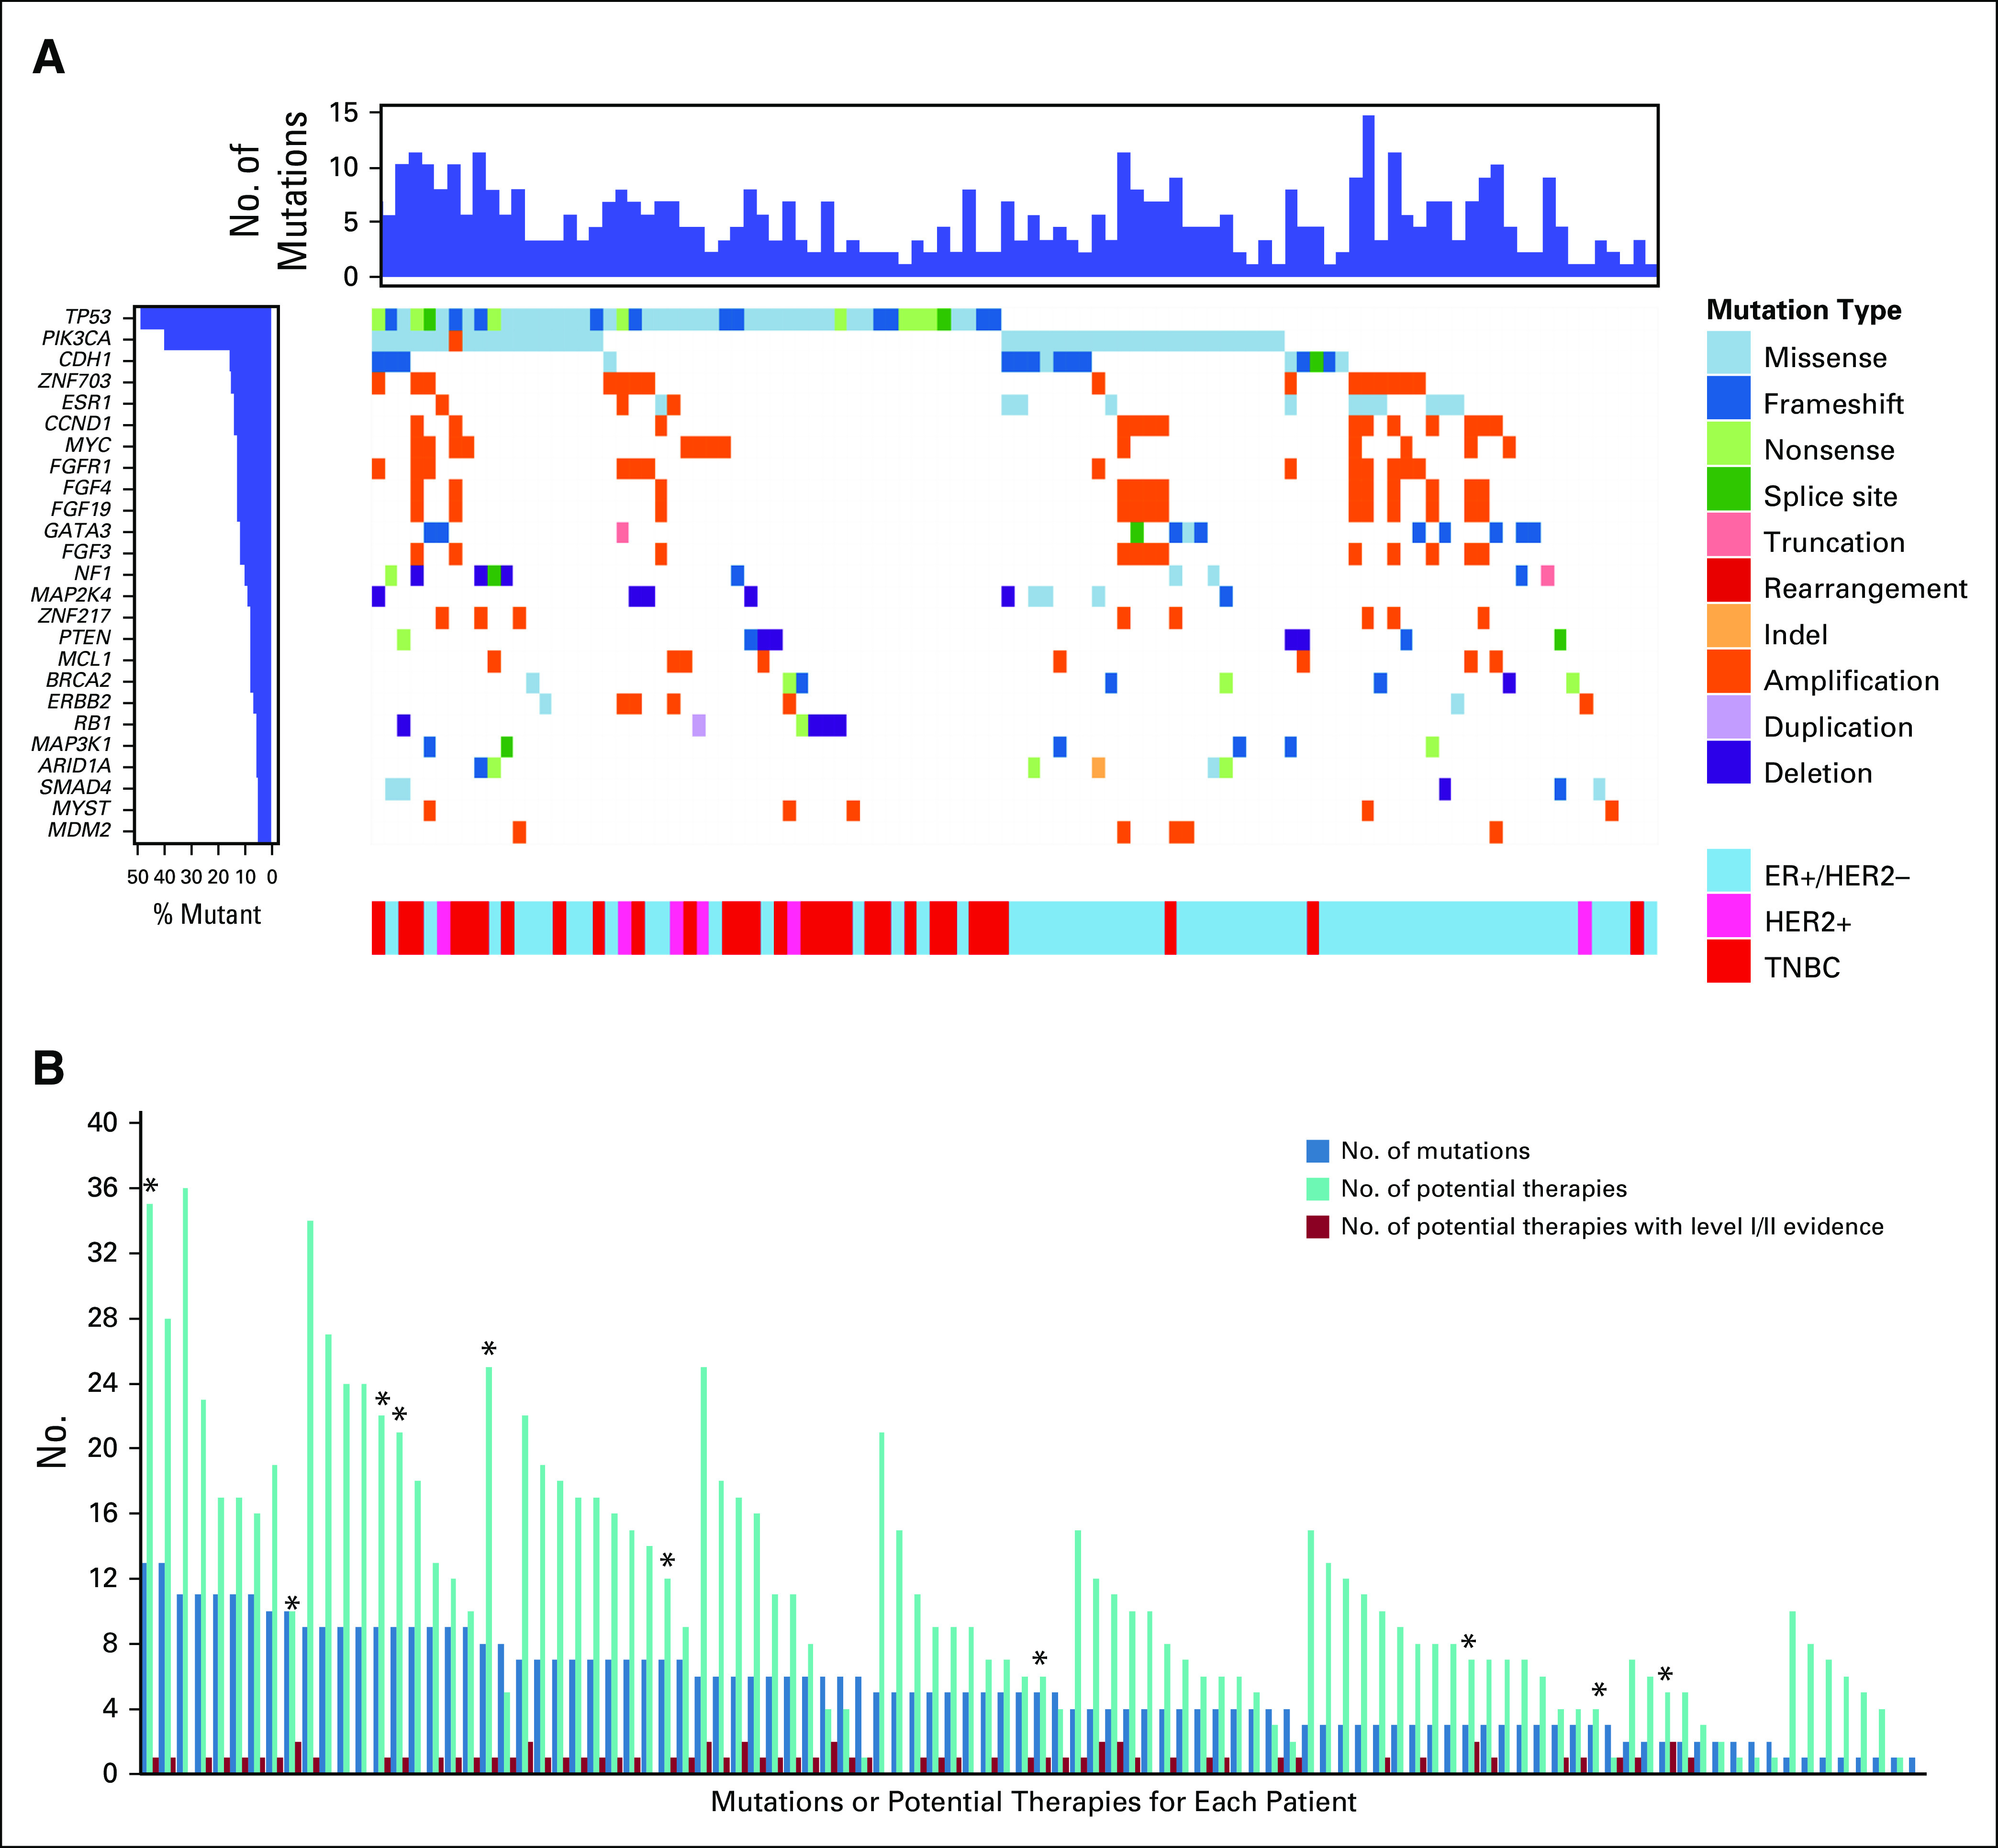
FIG 2.

Genomic alterations and therapeutic implications. (A) Patient-level (n = 100) mutation plot of the 25 most frequently altered genes in the study population. Left: frequency of the alteration in each gene; top: number of detected mutations per patient; bottom: receptor subtype. CoMut plot created by using the GenVisR package.47 (B) For each patient (n = 100), the graph shows number of detectable mutations, number of potential therapies identified, and number of potential therapies with level I/II evidence for actionability in breast cancer based on Condorelli, et al.16 (*) Indicates patients whose treatment was changed based on genomic testing results.
