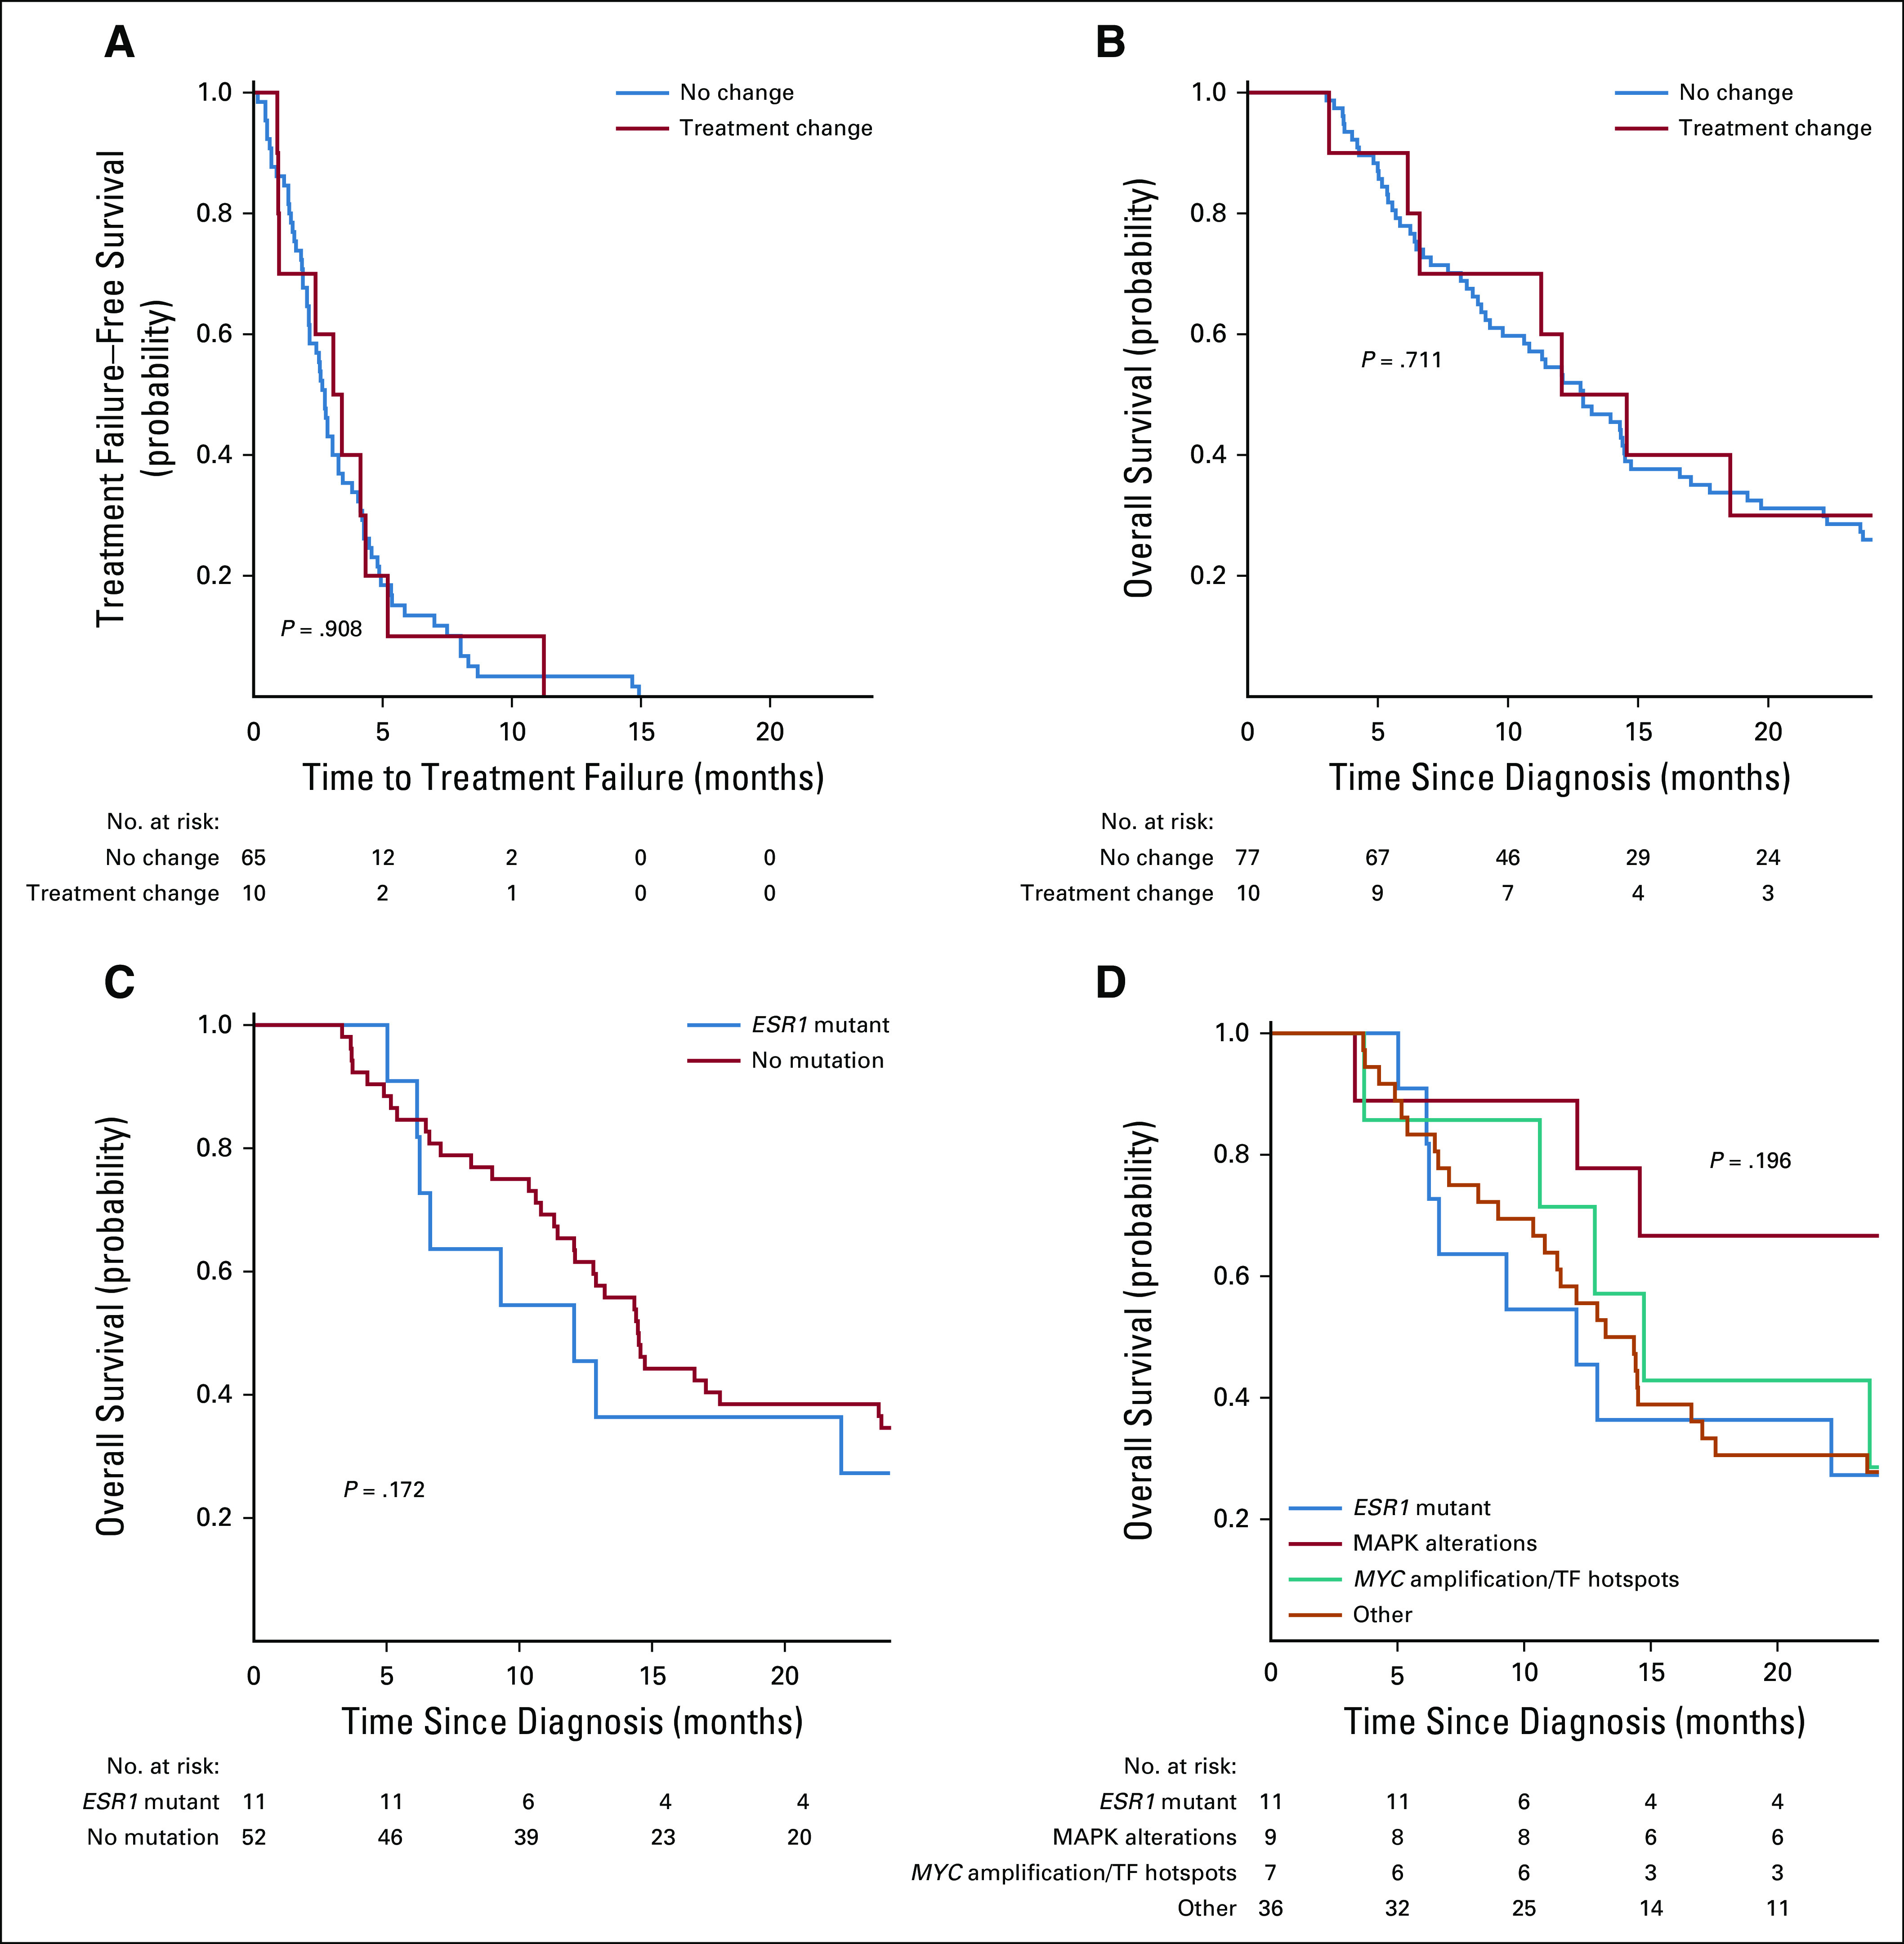
FIG 3.

Cohort survival analyses by receptor and genomic features. Kaplan-Meier plots with log-rank test P value. (A) Kaplan-Meier plot of time to treatment failure stratified by patients with treatment change based on genomic testing (red line) v no treatment change. Time to treatment failure defined as time from release of FoundationOne CDx results to the off-study date, defined as date of second progression or treatment change (first during the study period), death, or loss to follow-up. (B) Kaplan-Meier plot of overall survival by receptor status. Overall survival is defined as the period of time from the date of study enrollment to death or loss to follow-up. Patients who were still alive on December 18, 2018, were censored on this date. (C) Kaplan-Meier plot of overall survival for patients with estrogen receptor (ER)–positive/human epidermal growth factor receptor 2 (HER2)–negative metastatic breast cancer, stratified by presence or absence of mutation in ESR1. (D) Kaplan-Meier plot of overall survival for patients with ER-positive/HER2-negative metastatic breast cancer stratified by presence or absence of ESR1 mutation, MAPK pathway alteration, MYC amplification, transcription factor (TF) alteration, or other, as defined by Razavi, et al.15
