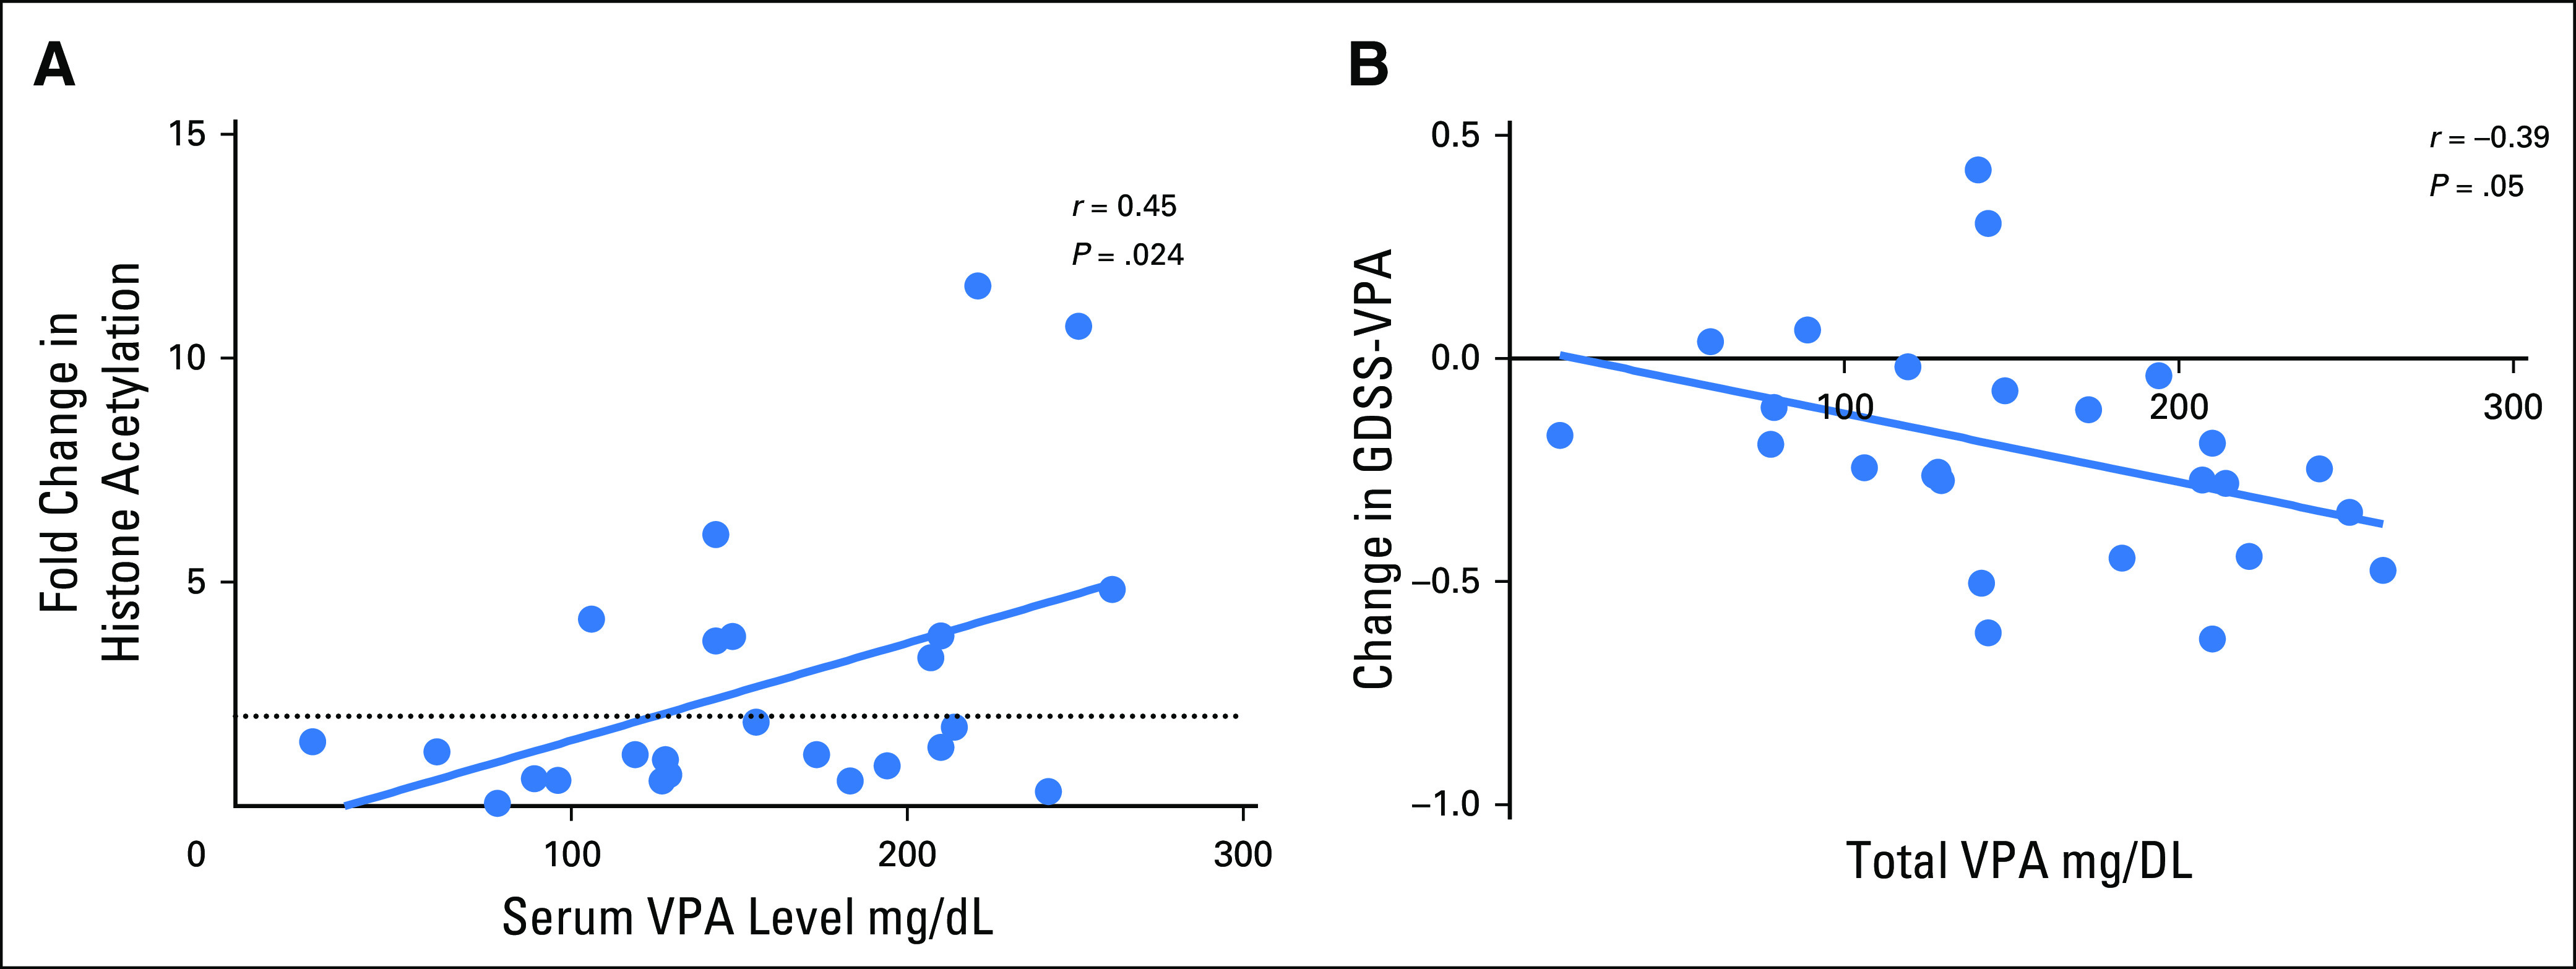
Fig 2.

(A) Scatter plot comparing serum valproic acid (VPA) level on the last day of treatment and the change in peripheral blood mononuclear cell histone 3 acetylation. The change in histone 3 acetylation is calculated as the ratio of the normalized expression of acetylated histone 3 by Western blot on the final day of treatment to that before treatment. (B) Scatter plot comparing the total serum VPA level on the last day of treatment and the change in genomically derived sensitivity signature for VPA (GDSS-VPA).
