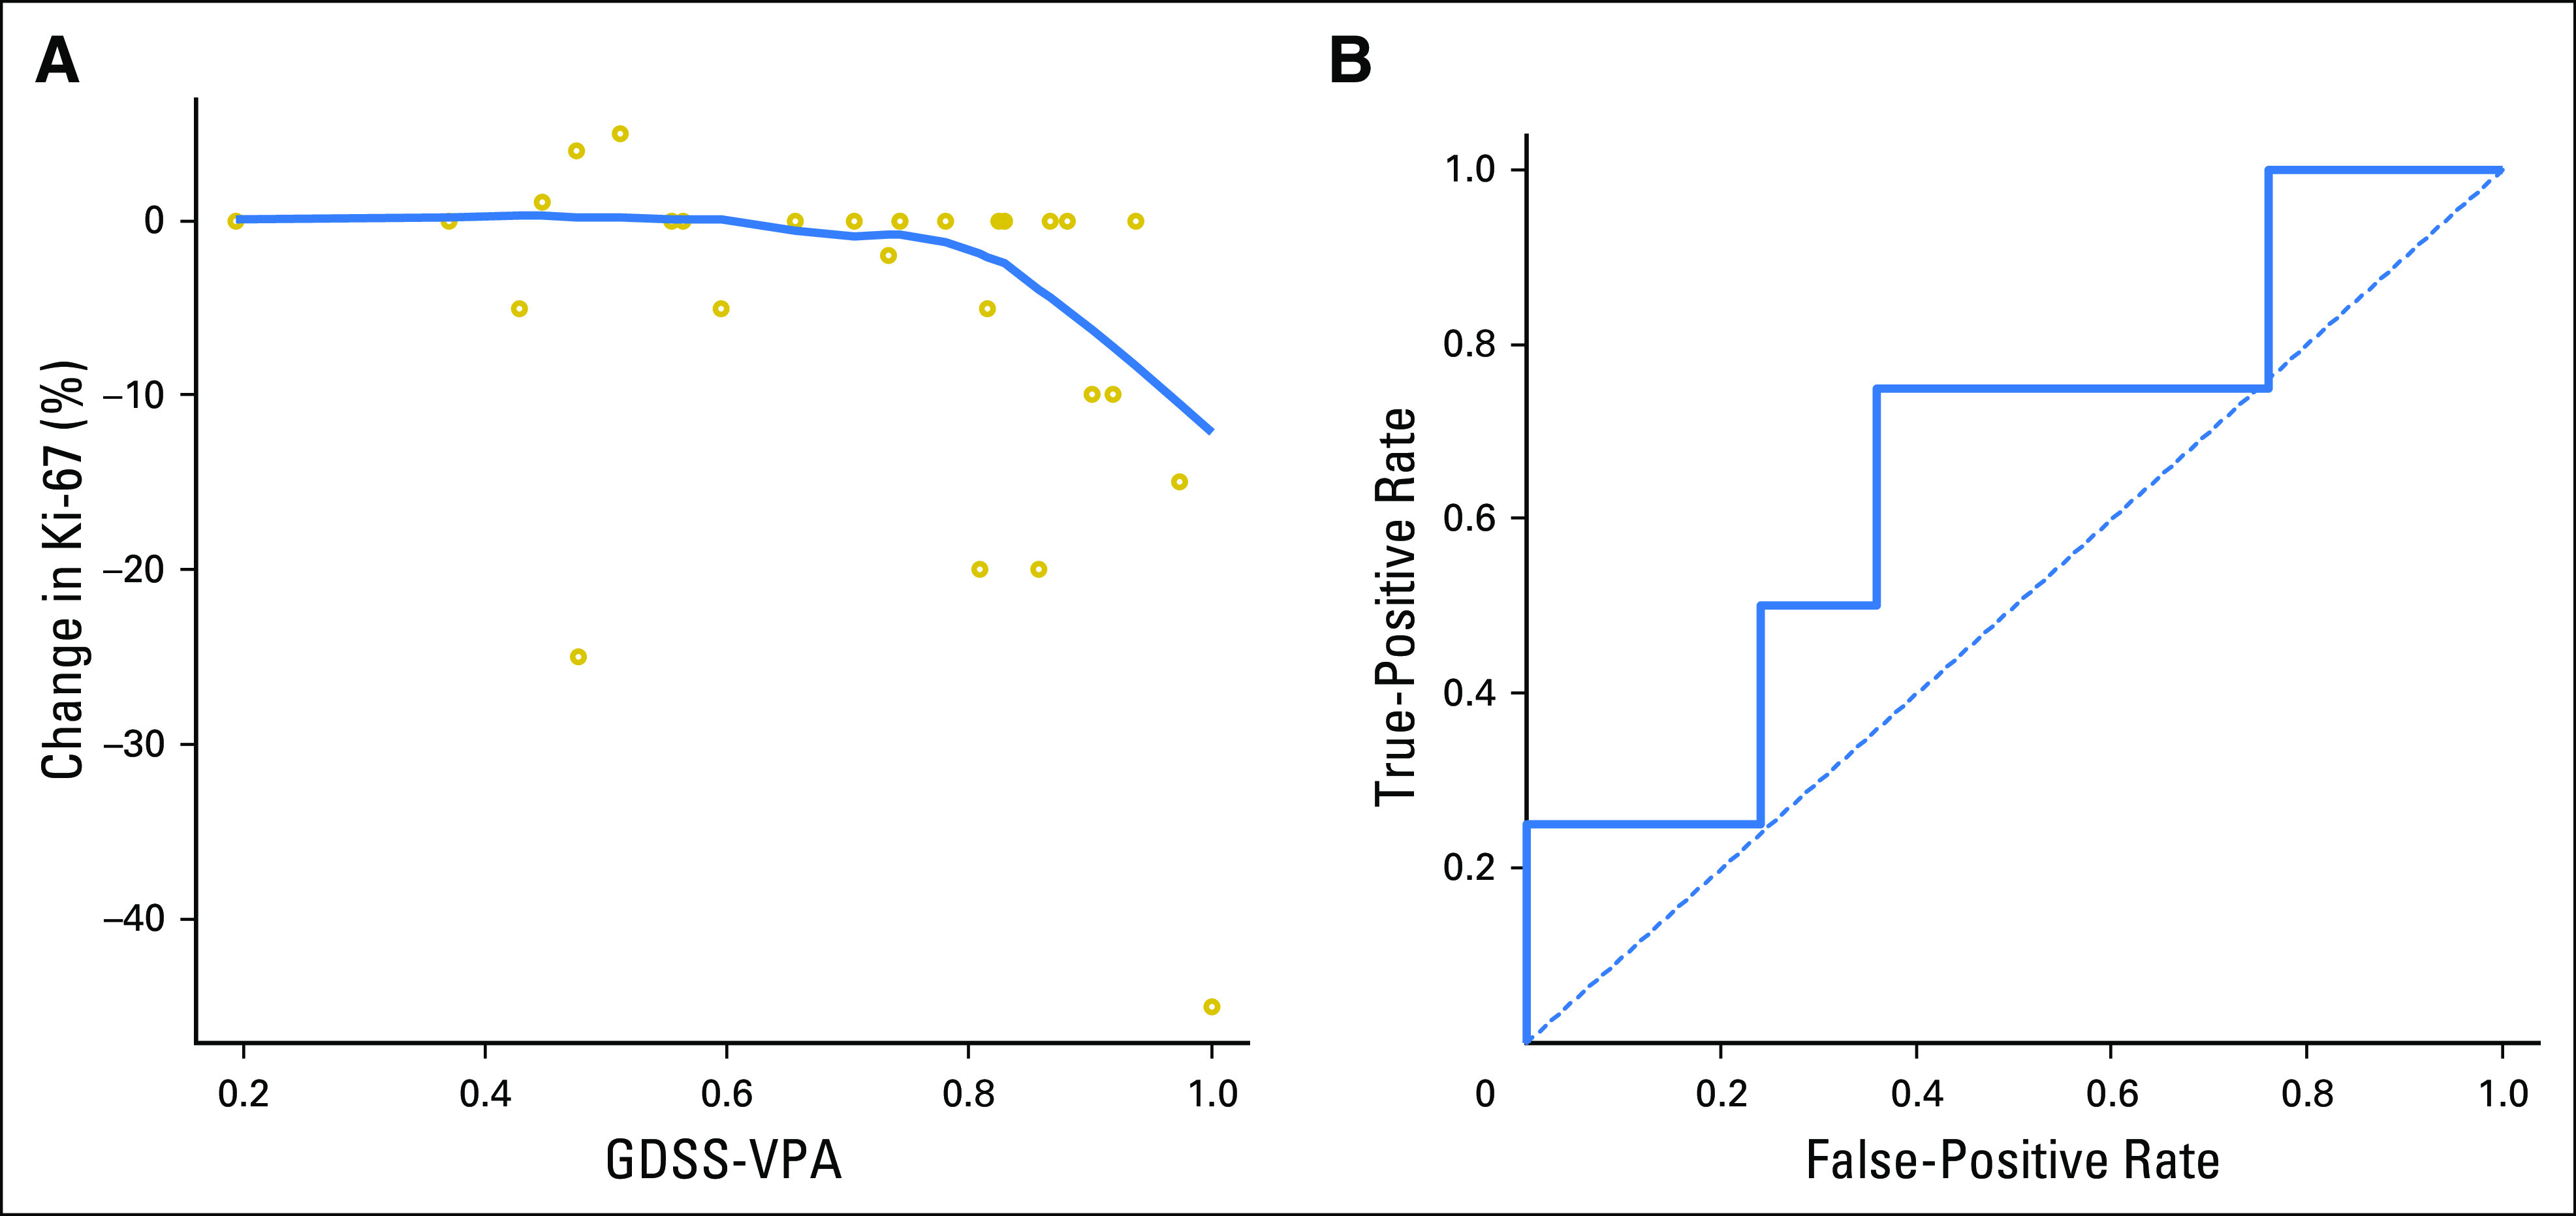
Fig 4.

(A) Scatter plot comparing genomically derived sensitivity signature for valproic acid (GDSS-VPA) prediction to the change in Ki-67 from the pretreatment tumor to the post-treatment tumor. The prediction ranges from 0 (predicted most resistant) to 1 (predicted most sensitive). The curved line gives a LOWESS regression curve. (B) Receiver operating characteristic curve for the GDSS-VPA predictor for predicting a decrease in Ki-67 of 20%.
