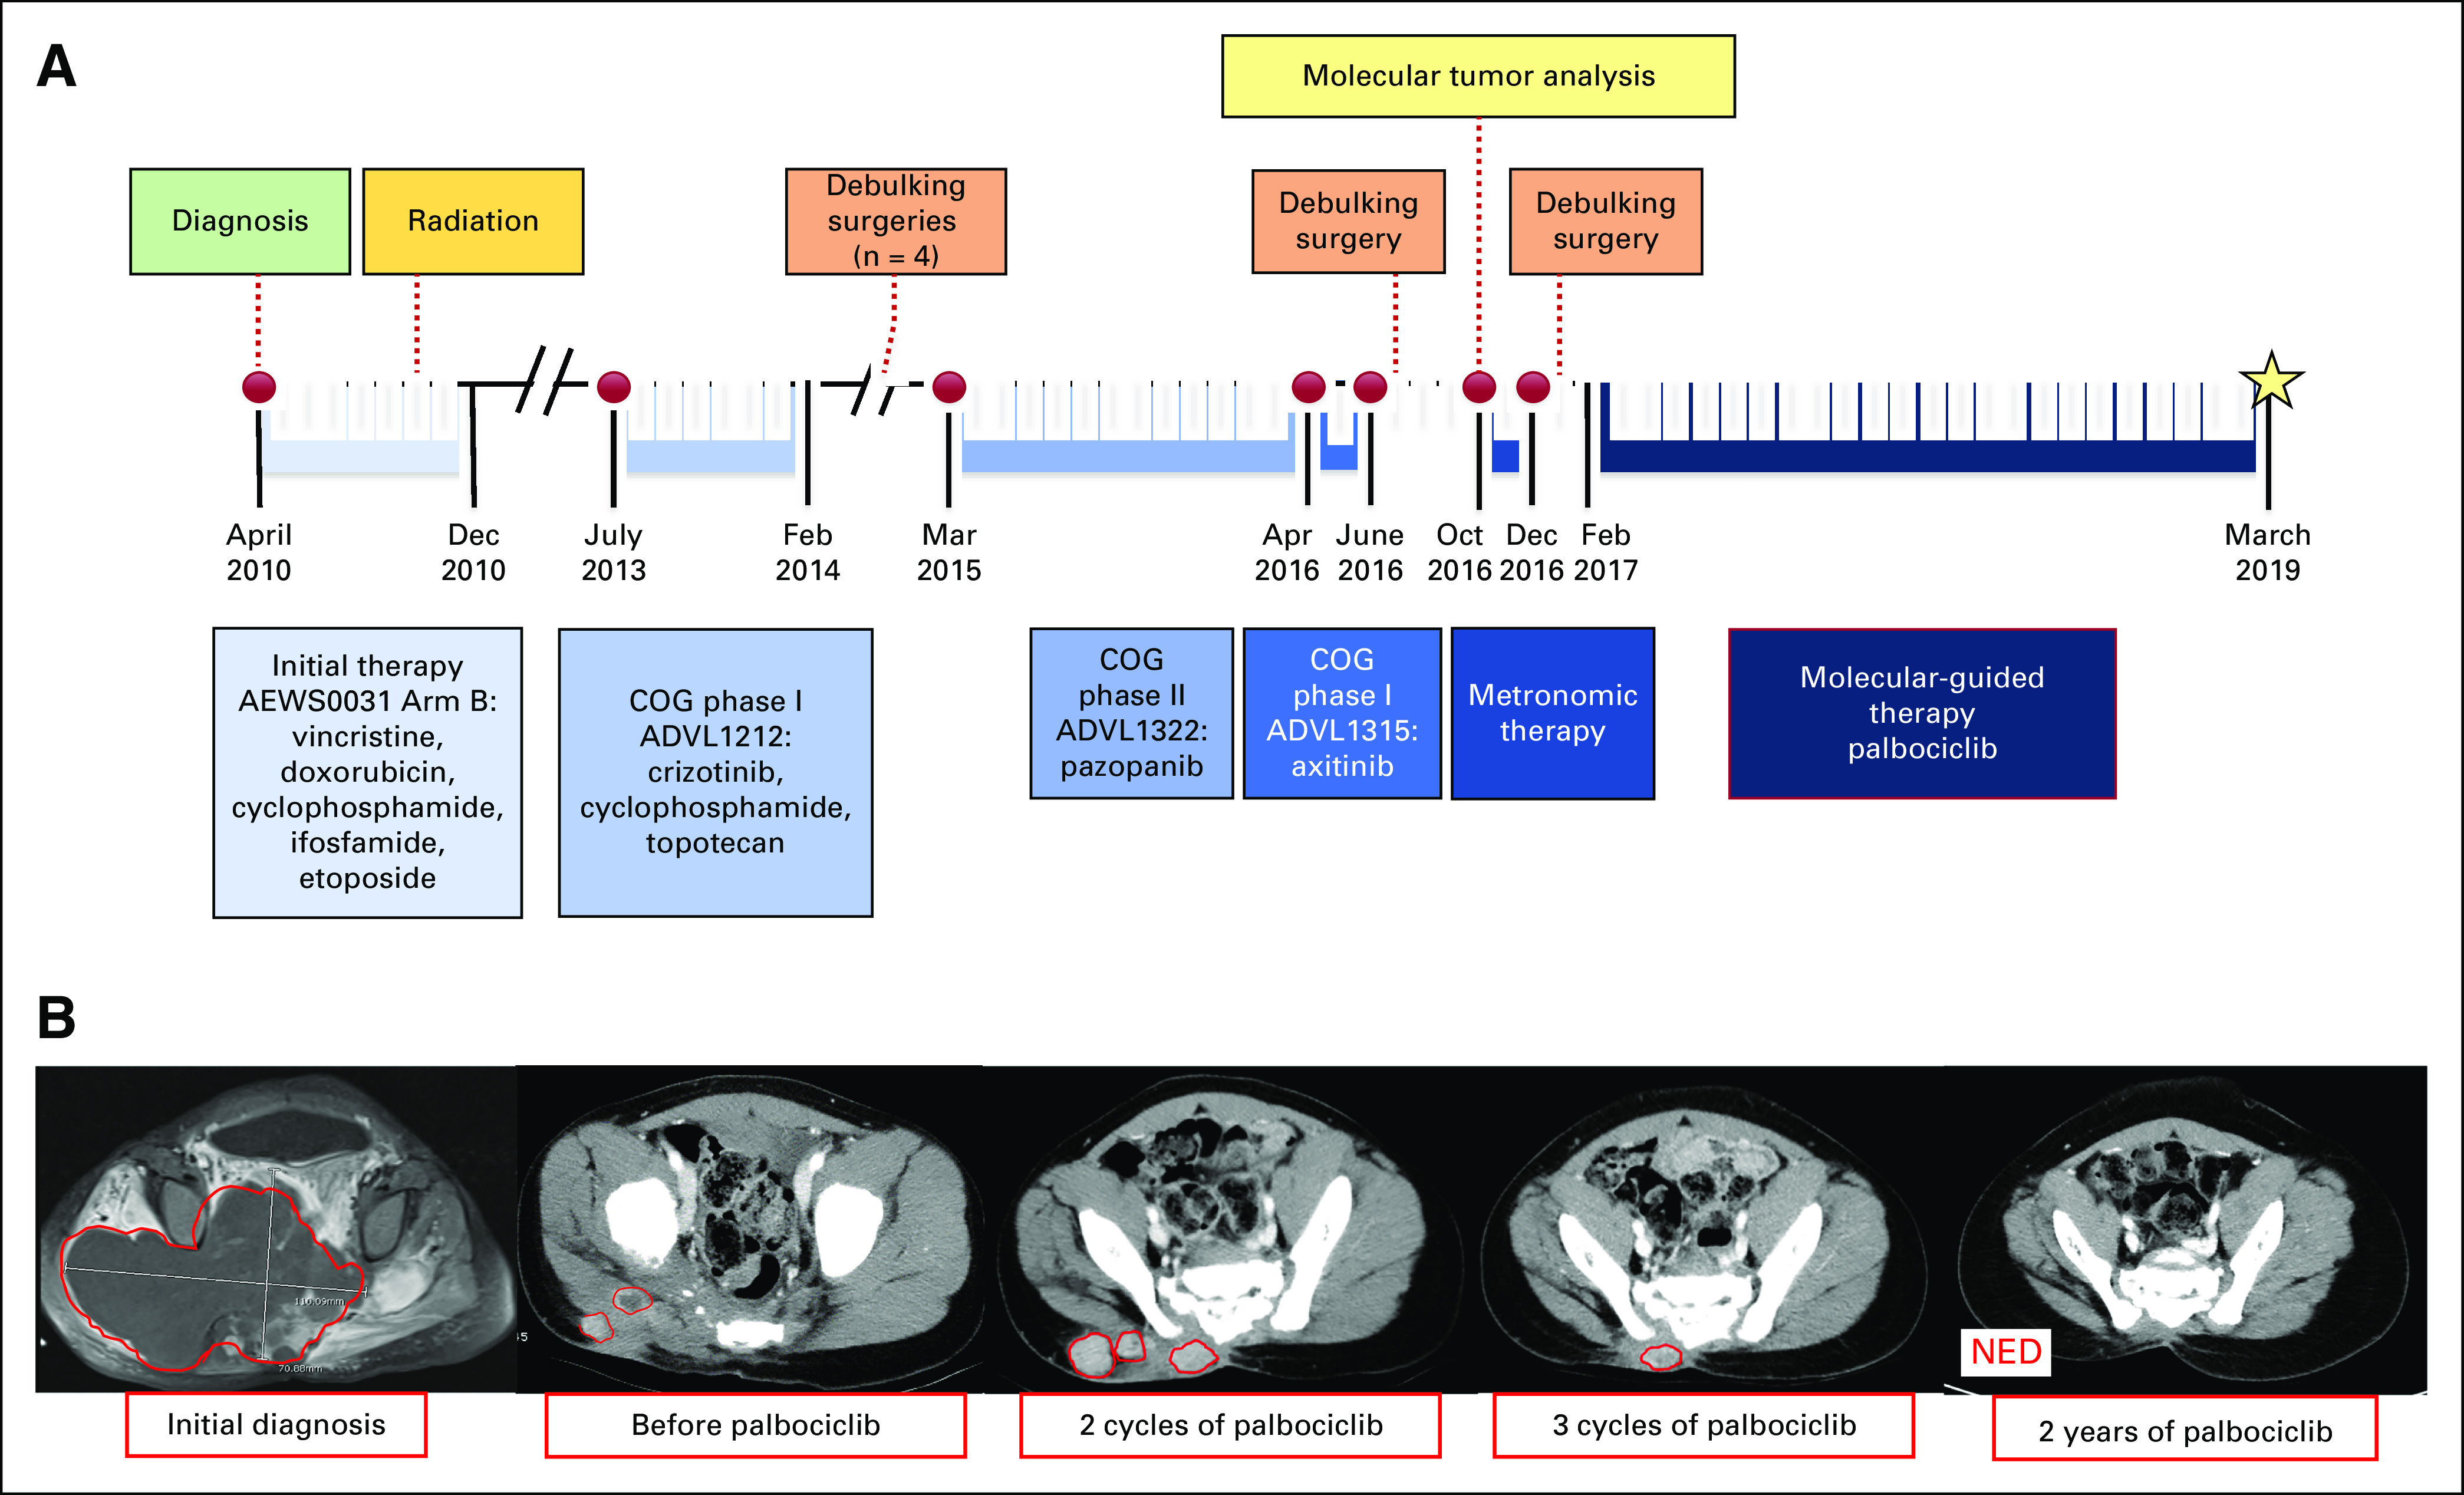
FIG 1.

Patient timeline and response imaging. (A) The timeline of treatments and disease recurrences and progression in our patient. Red circles represent time of recurrence or progression. Hash marks represent prolonged period of time progressed through therapy (not to scale of remaining timeline). Patient is still continuing with palbociclib therapy after the most recent scans in March 2019. (B) Patient imaging displayed with initial diagnostic magnetic resonance imaging from 2010; subsequent relapse scans were done via computed tomography imaging. Red lines outline tumor boundaries. There was concern for progression after 2 cycles of palbociclib, but there was a 2-month lag between the “before palbociclib” scan and actually starting drug, so interval progression likely occurred in this timeframe. No new baseline scan was performed on the day palbociclib started. Each cycle of palbociclib was 28 days. NED, no evidence of disease.
