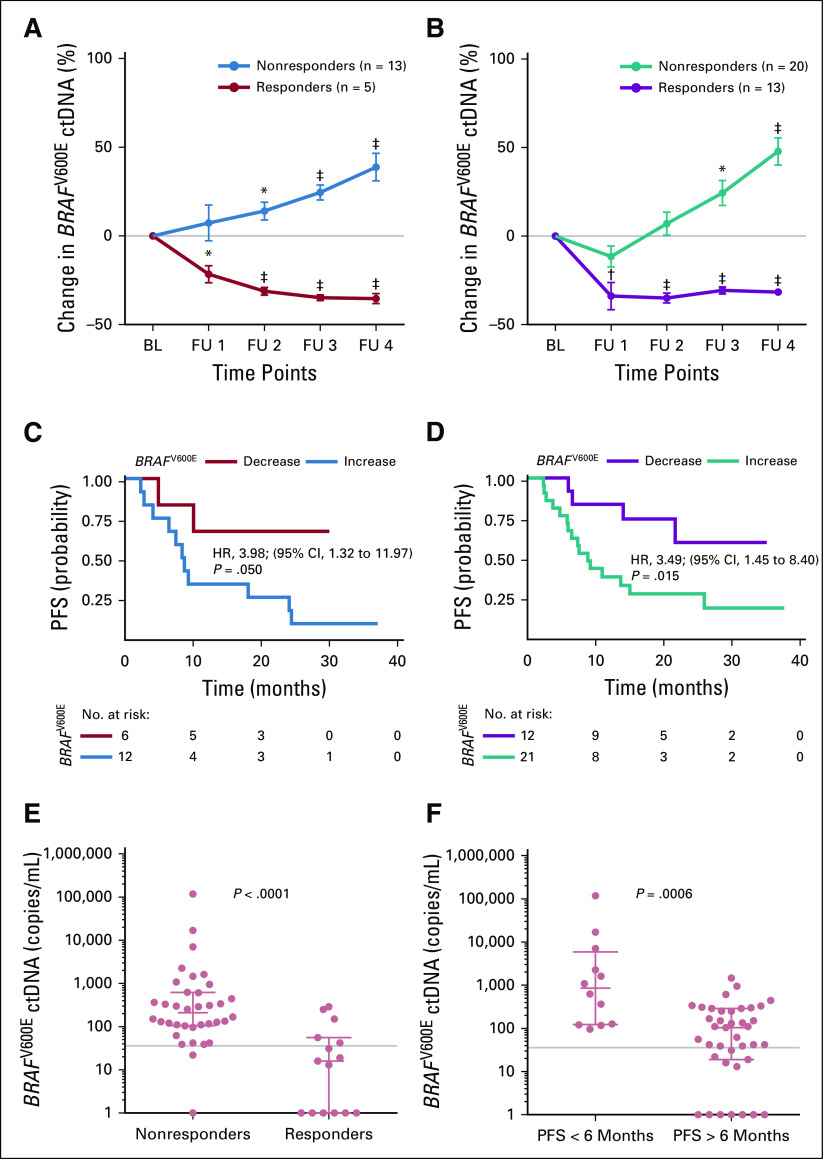
FIG 3.
Changes in the BRAFV600E circulating cell-free tumor DNA (ctDNA) levels correlate with therapy response and progression-free survival (PFS). Changes in mean BRAFV600E ctDNA levels after therapy initiation relative to baseline (BL) in patients who received (A) immune checkpoint inhibition therapy (n = 18 patients) and (B) signaling targeted therapy (n = 33). Follow-up (FU) sampling was performed every 4 to 6 weeks. (*) P < .01, (†) P < .001, and (‡) P < .001 from unpaired t test. The data represent mean ± SEM. Kaplan-Meier plots are for PFS of the same patients with melanoma as assessed by routine radiologic scans. (C) Immune checkpoint inhibition (patients with ctDNA decrease [n = 6] v increase [n = 12]) and (D) signaling targeted therapy (patients with ctDNA decrease [n = 12] v increase [n = 21]). Categorization into decrease versus increase was based on the ctDNA change at the second sampling time point relative to BL. The hazard ration (HR) is indicated for ctDNA increase. The P value was determined by the log-rank test. (E, F) Scatter dot plots of BRAFV600E ctDNA levels of responders versus nonresponders grouped according to (E) radiologic response 10 weeks after receiving any therapy or (F) radiologic PFS at 6 months of therapy (Mann-Whitney U test). Points represent individual patients; median with interquartile range is indicated for each plot. Gray lines indicate ctDNA thresholds as determined by receiver operating characteristic analyses (Data Supplement).

