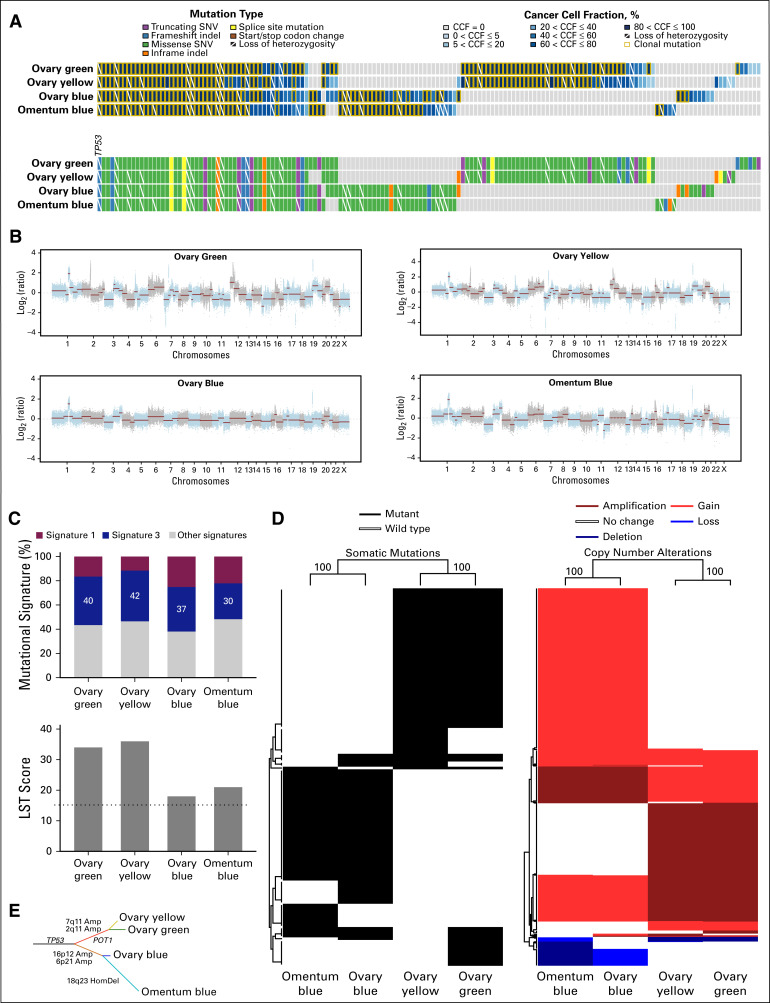
FIG 2.
Genomics analysis of the imaging-based high-grade serous ovarian cancer areas. (A) Nonsynonymous somatic mutations identified in each of the imaging-based high-grade serous ovarian cancer (HGSOC) areas (bottom). Cancer cell fractions (CCFs) of the mutations identified (top). Color-coding according to the legend. Clonal mutations are depicted by an orange box, and loss of heterozygosity by a diagonal bar. (B) Copy number alterations of the distinct imaging-based HGSOC areas. In the genome plots, segmented log2 ratios (y-axis) are plotted according to their genomic positions (x-axis). Alternating blue and gray demarcate the chromosomes. (C) Mutational signatures (top) and large-scale state transitions (LSTs; bottom) of the imaging-based HGSOC areas. The cutoff of a high LST score of 15 or greater is marked by a dotted line. (D) Unsupervised hierarchical clustering of the somatic mutations (left) and of the gene copy number alterations (right) identified not to be shared by all four imaging-based HGSOC areas using Ward’s algorithm and Euclidean distance. Left, genes affected by mutations are shown in black; right, amplification, gain, loss, and deletion are shown in dark red, red, blue, and dark blue, respectively. The values on the edges of the clustering are derived from pvclust analysis to assess the stability of the clusters; both the approximately-unbiased and bootstrap-probability P values were 100%. (E) Phylogenetic tree depicting the evolution of the imaging-based HGSOC areas constructed using the maximum parsimony method. The colored branches represent each of the subclones identified, and selected somatic mutations and gene copy number alterations that define a given clone are illustrated along the branches. The length of the branches is representative of the number of somatic mutations and copy number alterations that distinguish a given clone from its ancestral clone. Amp, amplification; HomDel, homozygous deletion; indel, small insertion and deletion; SNV, single nucleotide variant.

