
FIG 2.
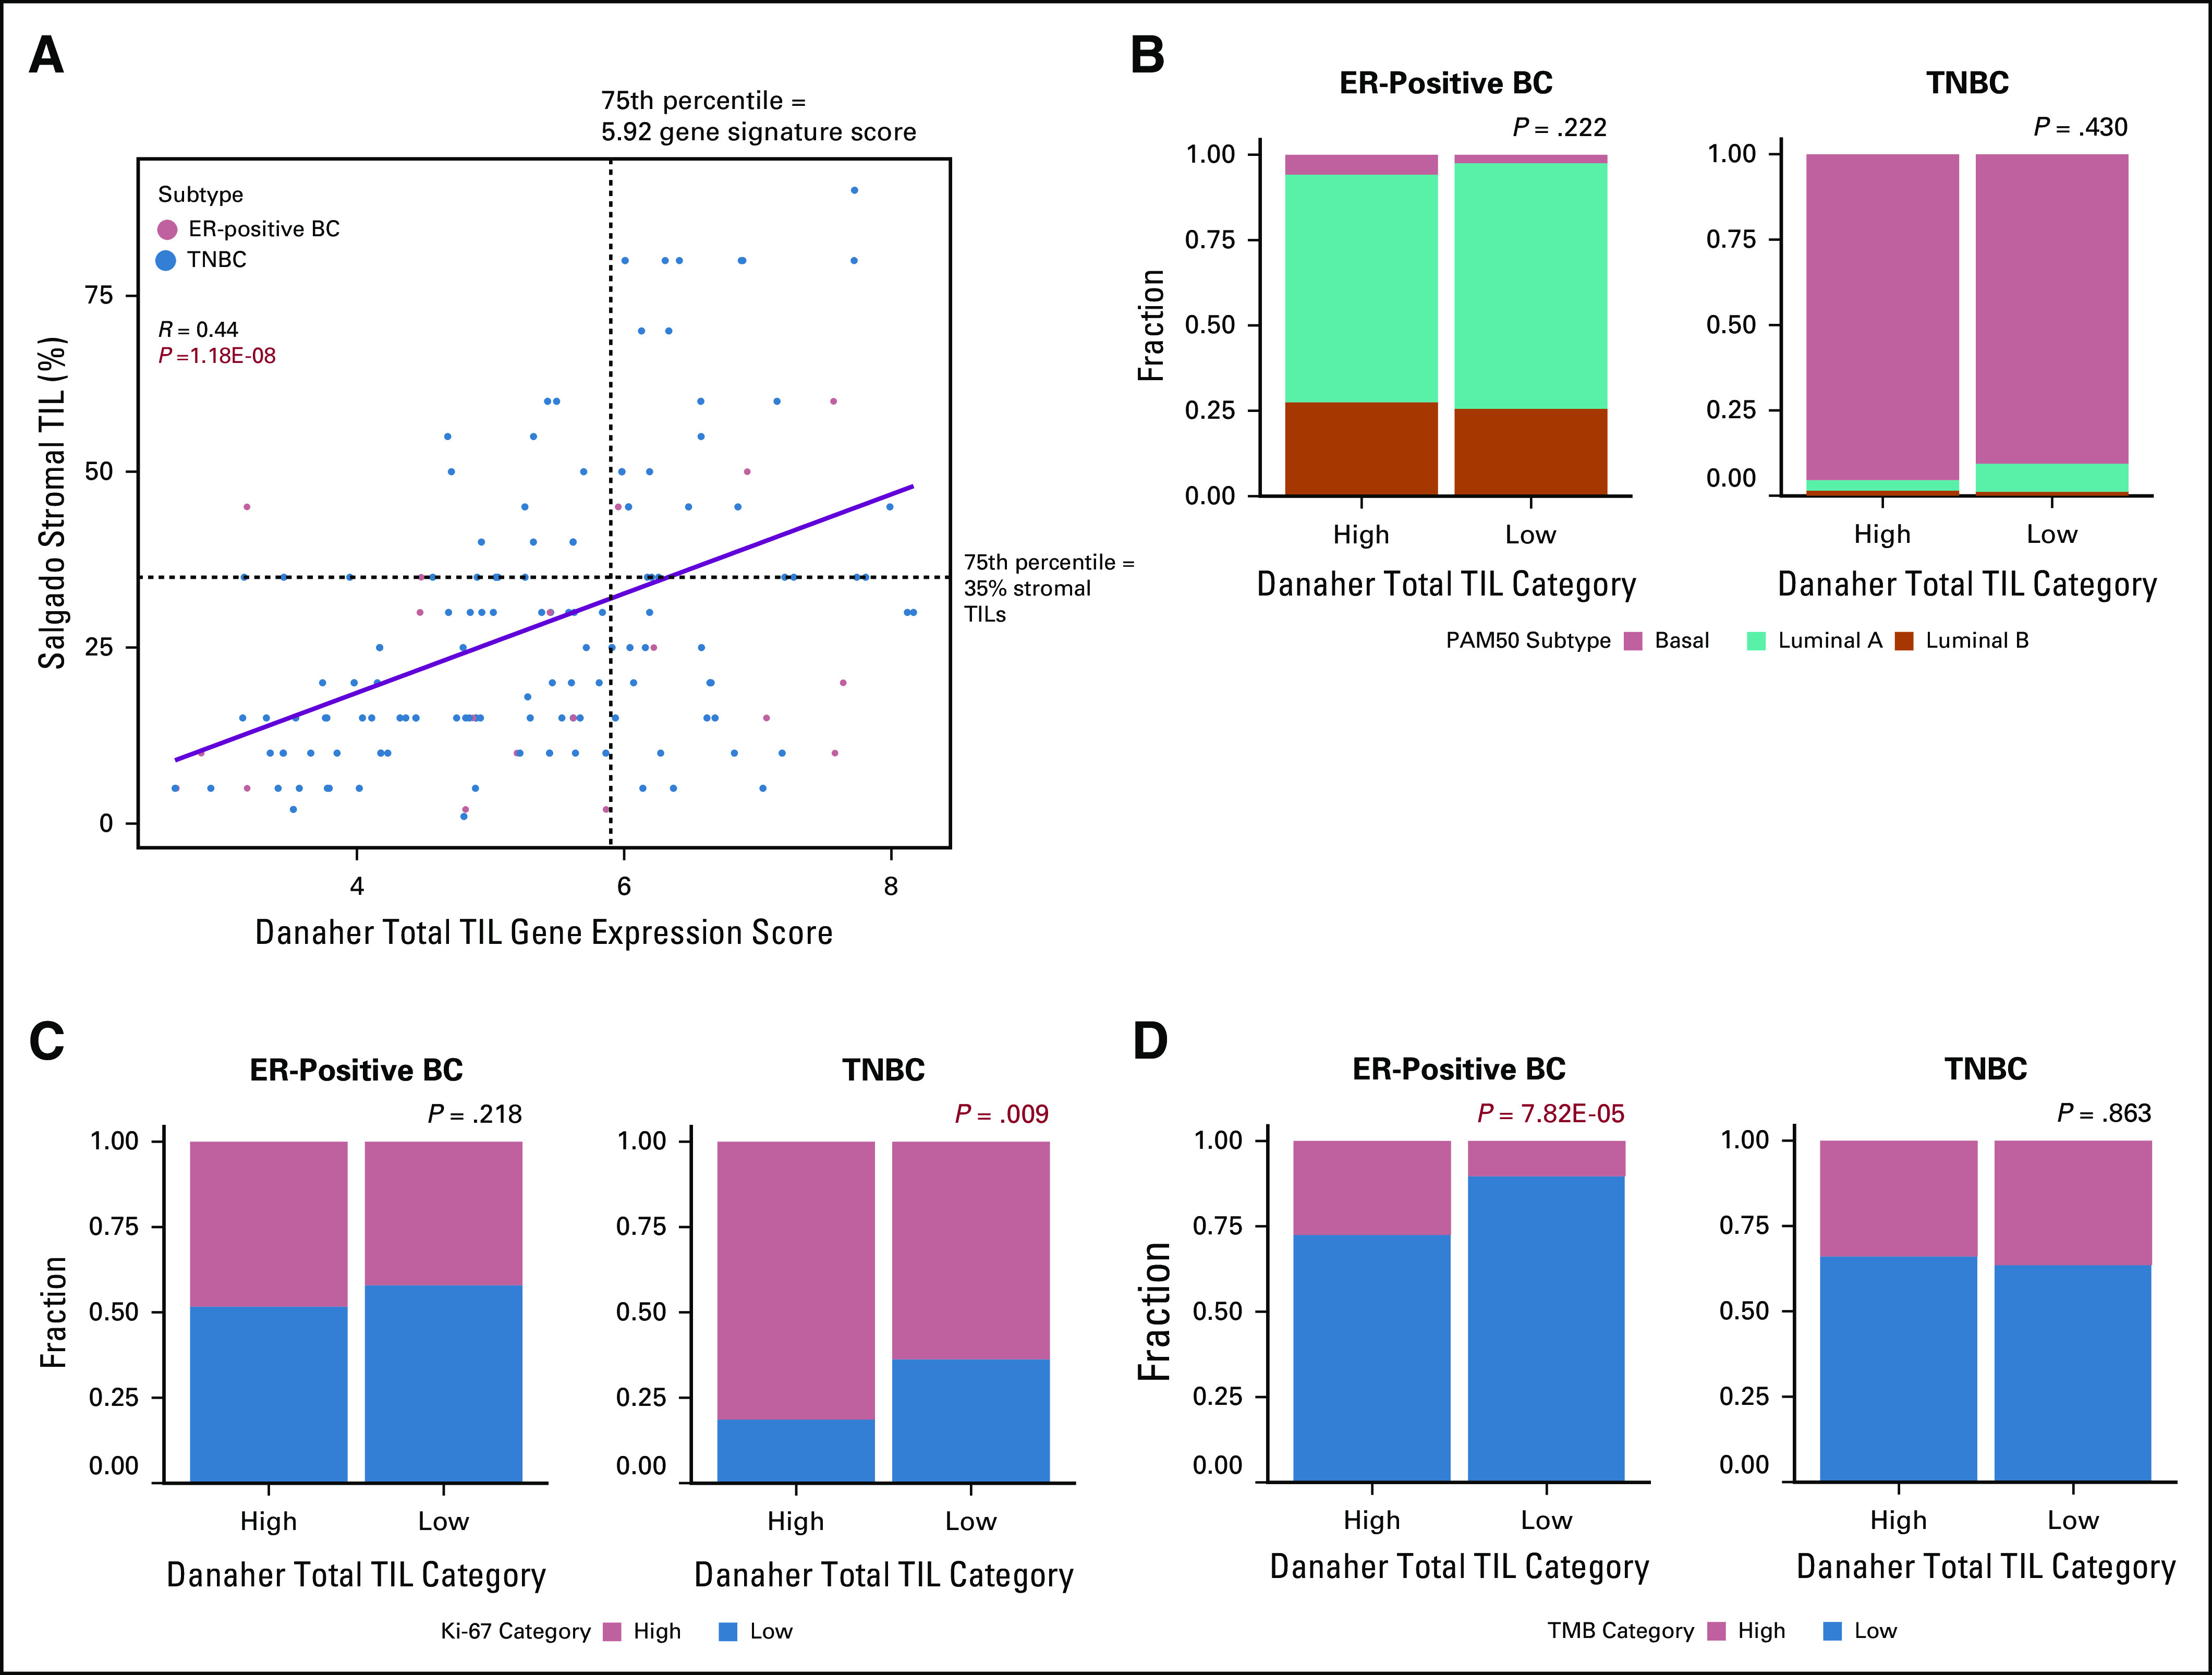
Validation of total tumor-infiltrating lymphocyte (TIL) gene signature scores. (A) For a subset of basal-like patients from The Cancer Genome Atlas (TCGA) with previously published histologic TIL scores (n = 156) according to Danaher et al,19 the total TIL gene signature scores (x-axis) were correlated with histologic stromal TIL counts (y-axis). The 75th percentile of histologic (35% stromal TILs) and gene signature TIL scores (5.92) are represented by dashed black lines. Tumor subtype is reflected by point color (estrogen receptor–positive breast cancers [ER-positive BCs], n = 21; triple-negative BCs ([TNBCs], n = 135). The linear regression line with 95% CIs is shown in blue. Pearson’s R = 0.44; P = 1.18E-08. (B-D) For all patients with ER-positive BCs (n = 697) and TNBCs (n = 191) in TCGA, patients were classified as immune cell “High” (Danaher et l19 total TIL gene signature score in the top 25th percentile) or “Low” (Danaher total TIL gene signature scores in the bottom 75th percentile), represented on the x-axis. Distributions of (B) PAM50 subtypes, (C) Ki-67 expression categories and (D) tumor mutation burden (TMB) categories were compared between patients with immune-rich high and low ER-positive BCs and TNBCs separately. PAM50 and TMB categories were obtained from previous publications, and Ki-67 categories were defined as greater than (high) or less than (low) the median Ki-67 expression level across all patients.