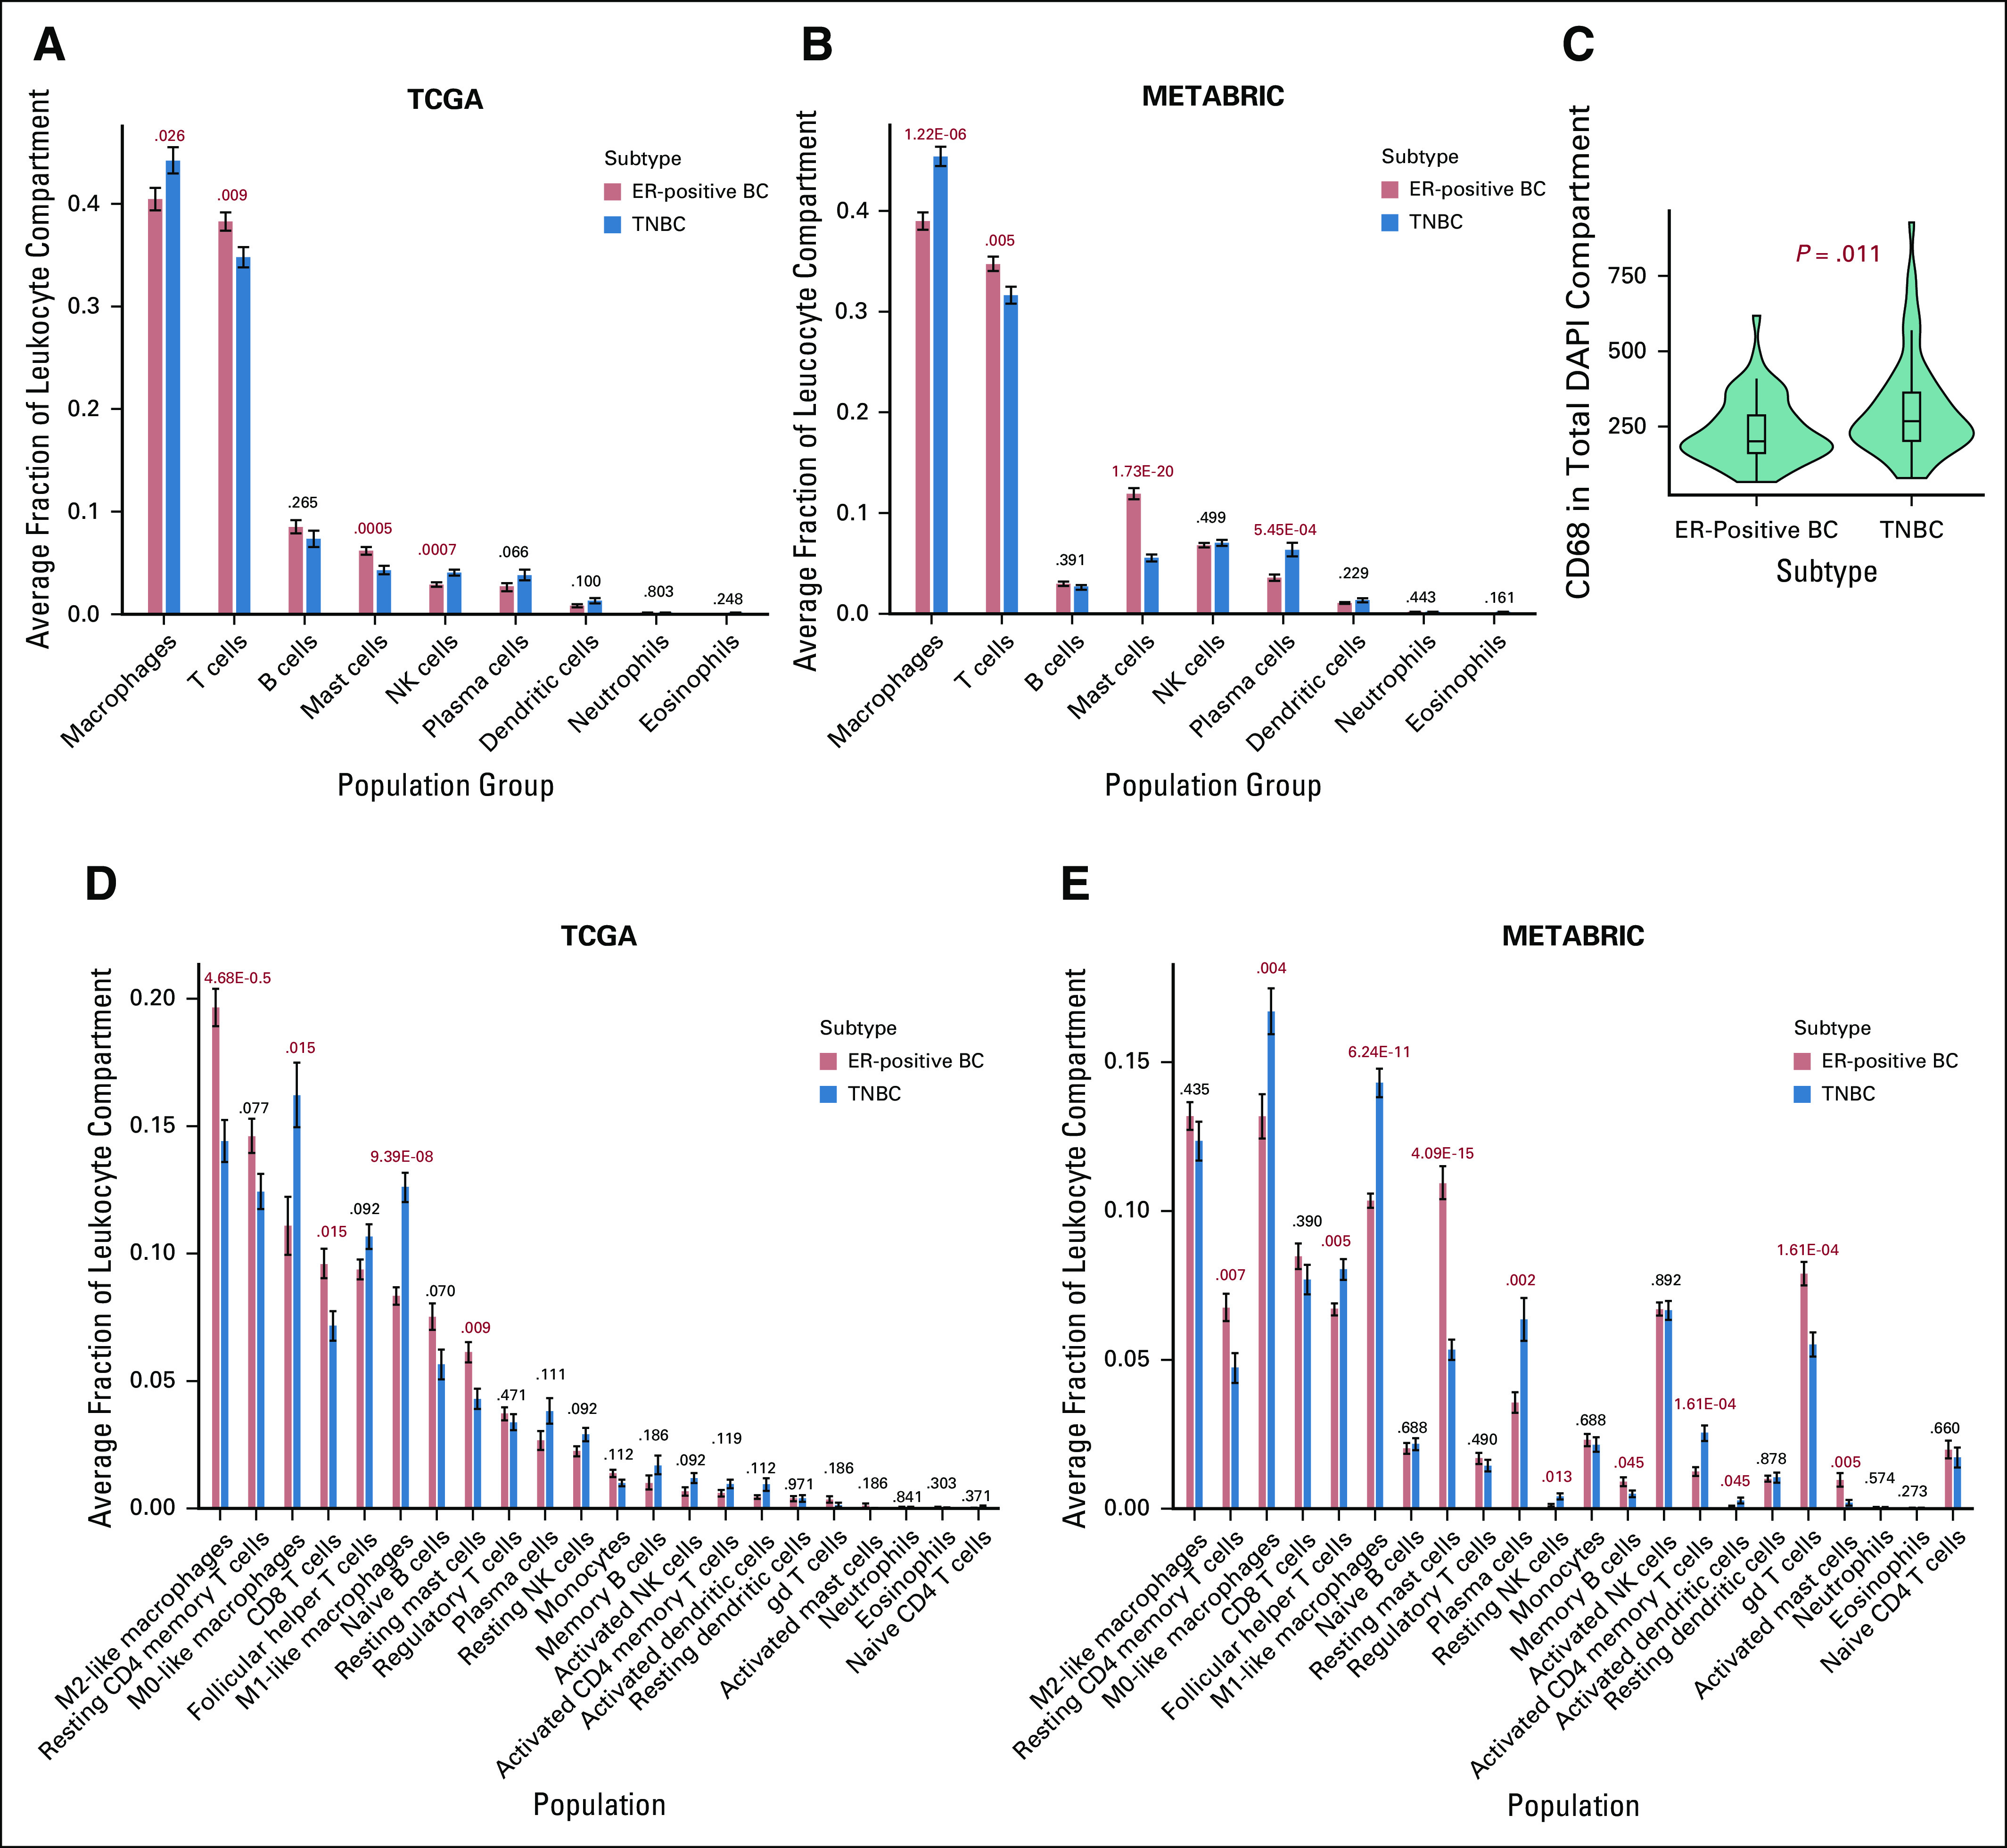
FIG 3.

Quantification of immune cell populations in the tumor environment of immune-cell rich patients. (A-B) CIBERSORT deconvolution was used to quantify relative fractions of immune cell populations in the tumor leukocyte compartment of immune-rich patients. For patients from (A) The Cancer Genome Atlas (TCGA) and (B) Molecular Taxonomy of Breast Cancer International Consortium (METABRIC) databases, 9 aggregate immune cell populations are listed on the x-axis, and the average fraction of each immune cell population for a certain subtype is quantified on the y-axis. Error bars represent standard error of the mean. Subtypes are designated by bar color. False discovery rate Padj values are provided above each subtype comparison. (C) Quantitative immunofluorescence (QIF) signal was compared between estrogen receptor–positive breast cancer (ER-positive BC;,n = 53) and triple-negative BC (TNBC; n = 63) formalin-fixed paraffin-embedded tumor microarray tissues. Subtype is shown on the x-axis, and CD68 QIF signal in the total 4′,6-diamidino-2-phenylindole (DAPI) compartment is quantified on the y-axis. For (D) TCGA and (E) METABRIC patients, 22 immune cell populations derived by CIBERSORT are listed on the x-axis, and the average fraction of each immune cell population for a certain subtype is quantified on the y-axis. Error bars represent standard error of the mean. Subtypes are designated by bar color. False discovery rate Padj values are provided for TCGA (ER-positive BCs, n = 119; TNBCs, n = 86) and METABRIC (ER-positive BCs, n = 225; TNBCs, n = 140) patients. NK, natural killer.
