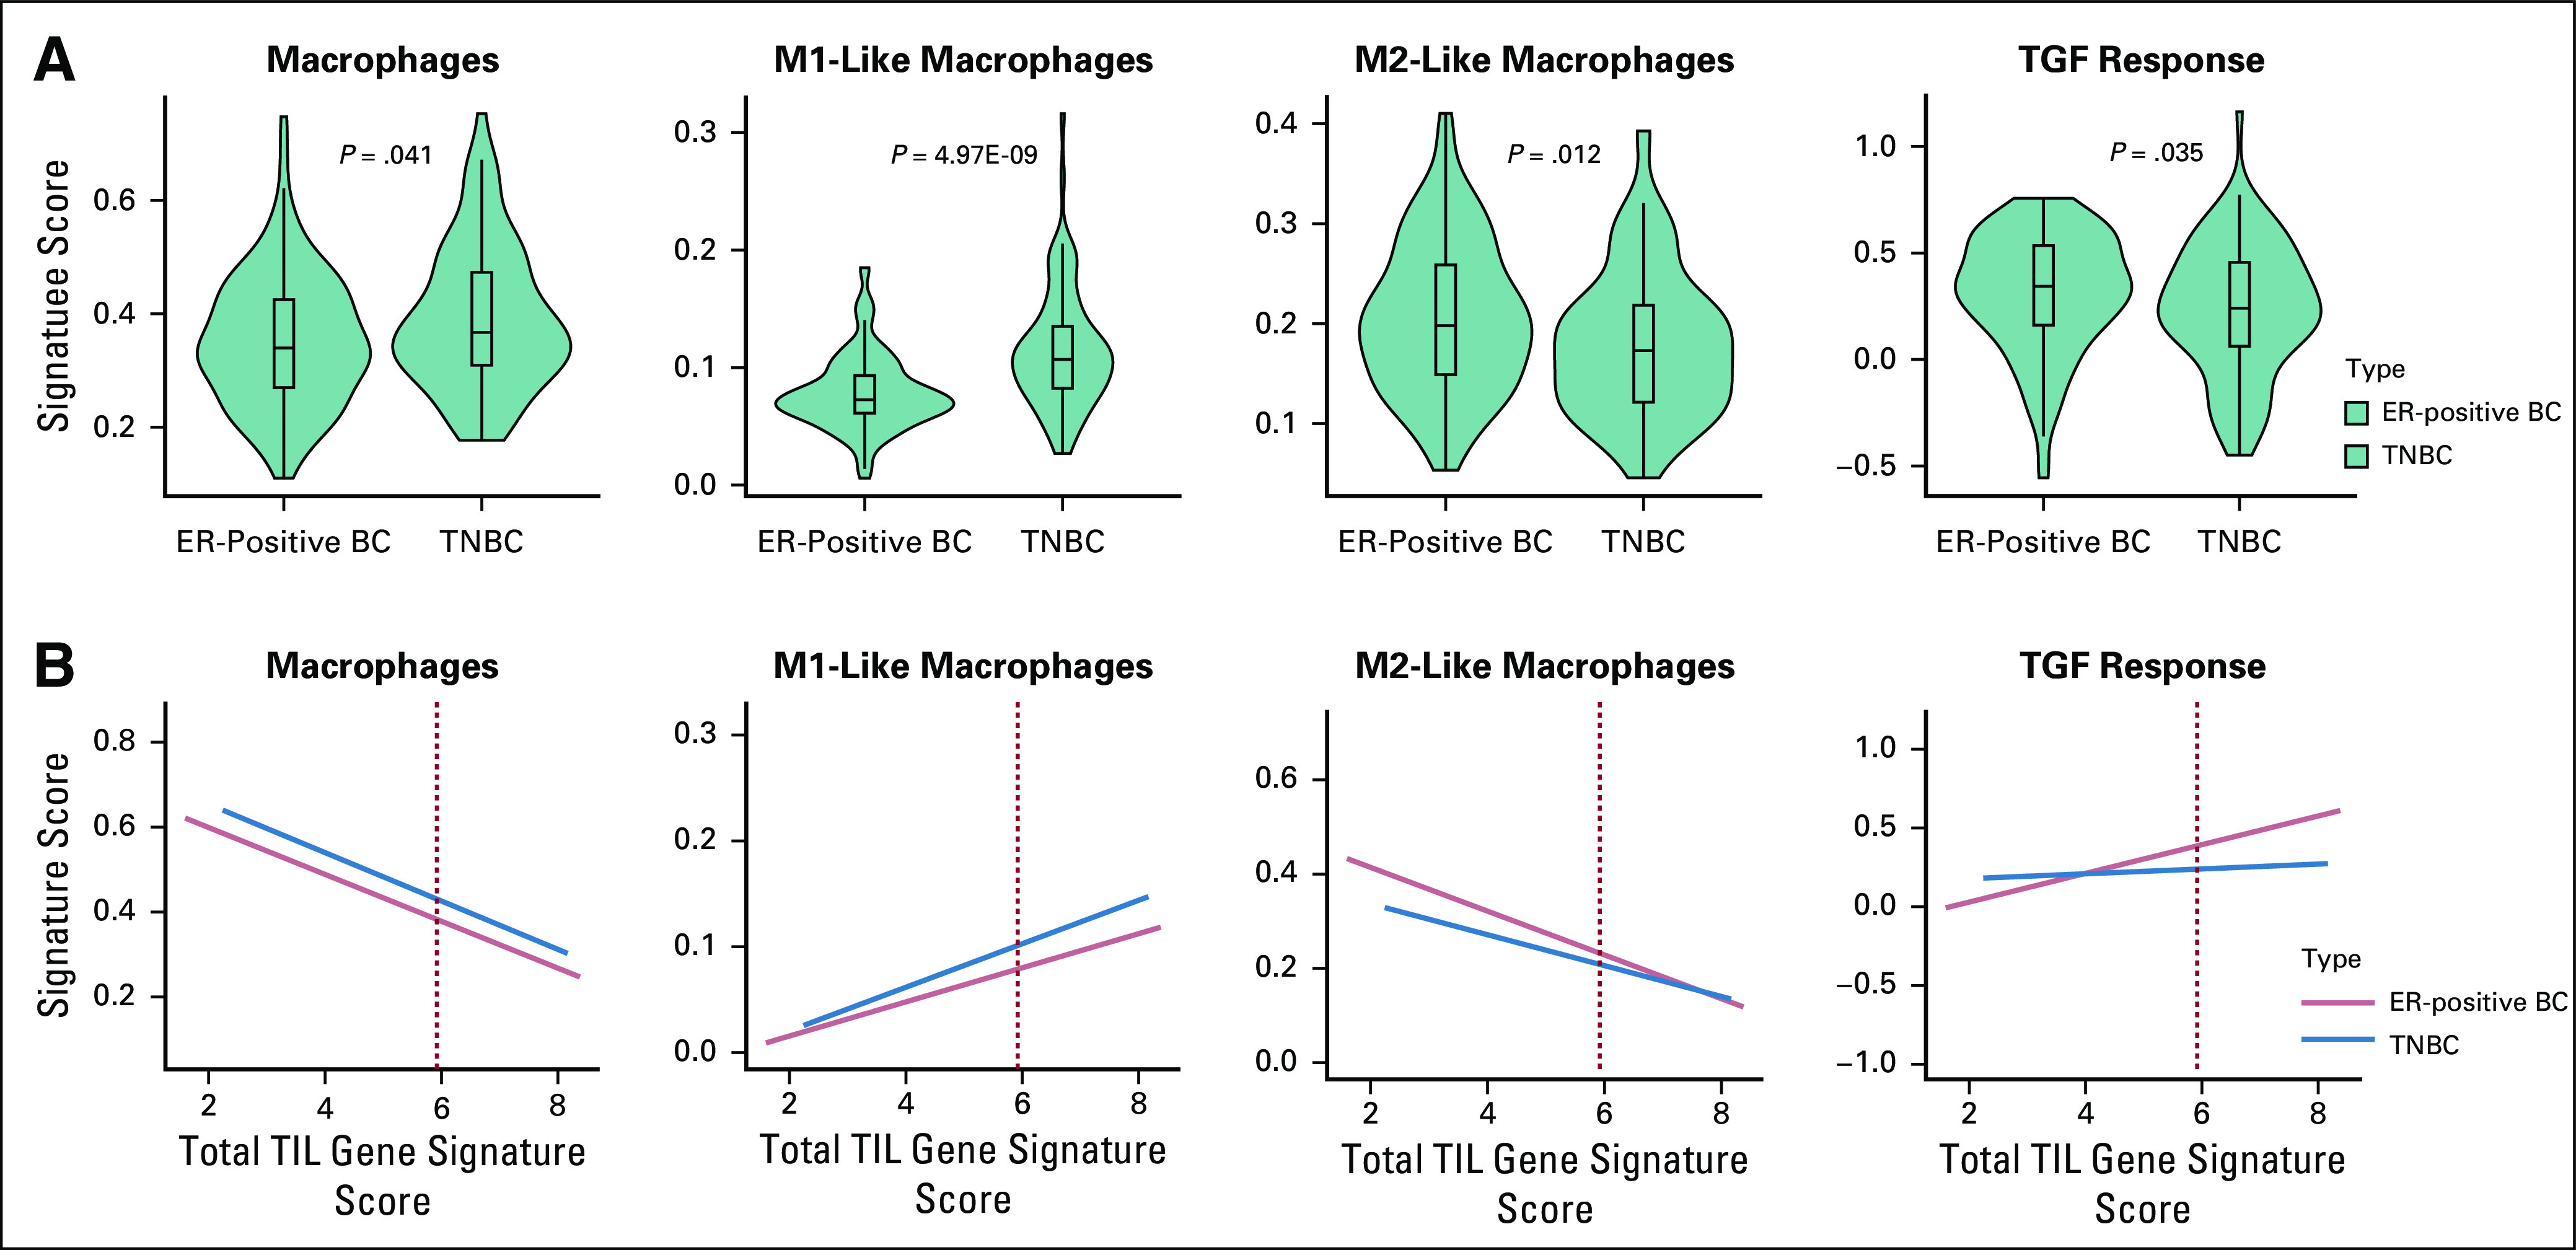
FIG 4.

Comparison of macrophage population and transforming growth factor β (TGF-β) response metagene expression scores between patients with immune-rich estrogen receptor–positive breast cancers (ER-positive BCs) and those with triple-negative BCs (TNBCs) in The Cancer Genome Atlas (TCGA). (A) Metagene expression scores for overall macrophages, M1-like macrophages, M2-like macrophages, and TGF-β response were compared between immune-rich ER-positive BC (red, n = 119) and immune-rich TNBC (blue, n = 86) patients in TCGA. Subtype is listed on the x-axis, and previously calculated metagene scores are quantified on the y-axis. (B) For all patients with ER-positive BCs (n = 697) and TNBCs (n = 191) in TCGA, gene expression signature scores for overall macrophages, M1-like macrophages, M2-like macrophages, and TGF-β response (y-axis) were plotted against total TIL gene signature scores (x-axis). Red dashed lines indicate the 75th percentile scores of total TIL gene signature scores, above which patients were considered immune rich. Linear regression lines for each subtype with 95% CIs are shown in red (ER-positive BC) or blue (TNBC).
