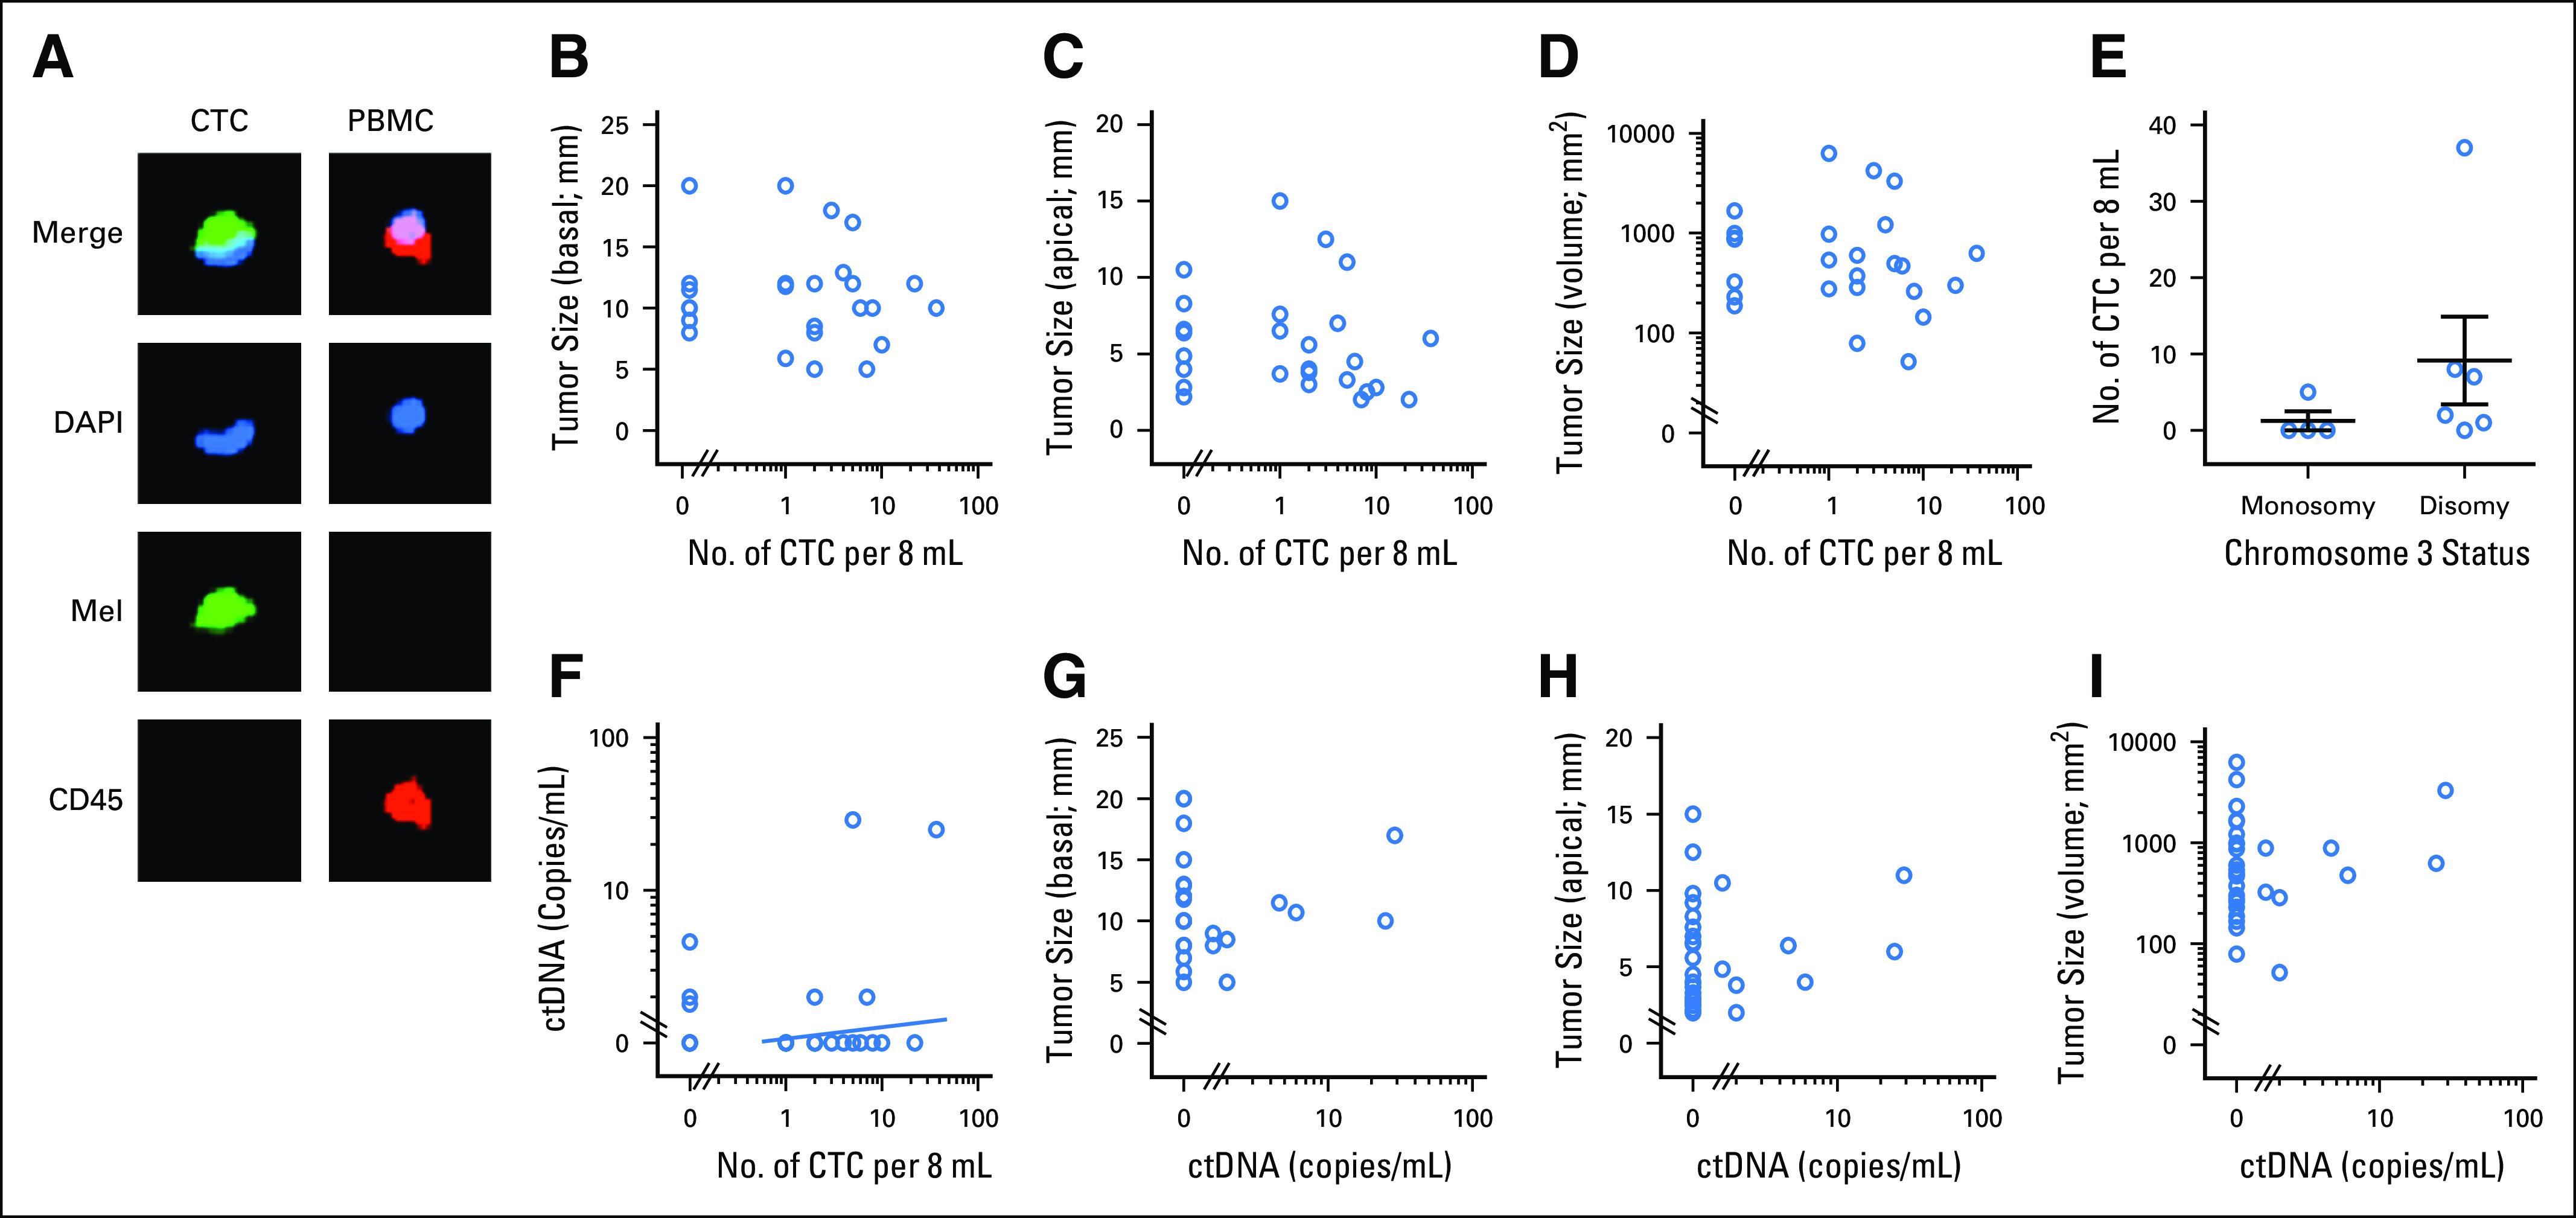
Fig 2.

Circulating tumor cell (CTC) and circulating tumor DNA (ctDNA) quantification in a primary uveal melanoma (UM) cohort. (A) Example of immunocytochemical staining of a UM CTC and peripheral blood mononuclear cell (PBMC). Green fluorescence (AF488, Mel) indicates staining with a combination of antibodies against the melanoma markers MART1/gp100/S100β; red fluorescence (phycoerythrin [PE]) indicates CD45 positivity; and blue fluorescence (4',6-diamidino-2-phenylindole, DAPI) indicates the presence of a nucleus. CTCs were identified as Mel-positive and DAPI-positive and CD45-negative cells. (B-E) Graphs illustrate (B) CTC count versus basal median diameter (n = 26; P = .874; r = −0.034), (C) tumor size as apical height (n = 26; P = .237; r = −0.250), or (D) tumor volume (n = 26; P = .338; r = −0.244). Spearman rank r and P values are indicated. (E) Comparison of CTC counts in patients with UM with and without chromosome 3 monosomy (n = 10). Mann-Whitney U test P value is indicated. (F-I) Graphs illustrate (F) ctDNA copies/mL versus CTC count in 8 mL of blood (n = 26), (G) ctDNA copies/mL versus basal median diameter (n = 30; P = .787; r = 0.053), (H) tumor size as apical height (n = 30; P = .384; r = −0.170), or (I) tumor volume (n = 30; P = .982; r = −0.004). Spearman rank r and P values are indicated. No correlation was found between CTC, ctDNA, and tumor size.
