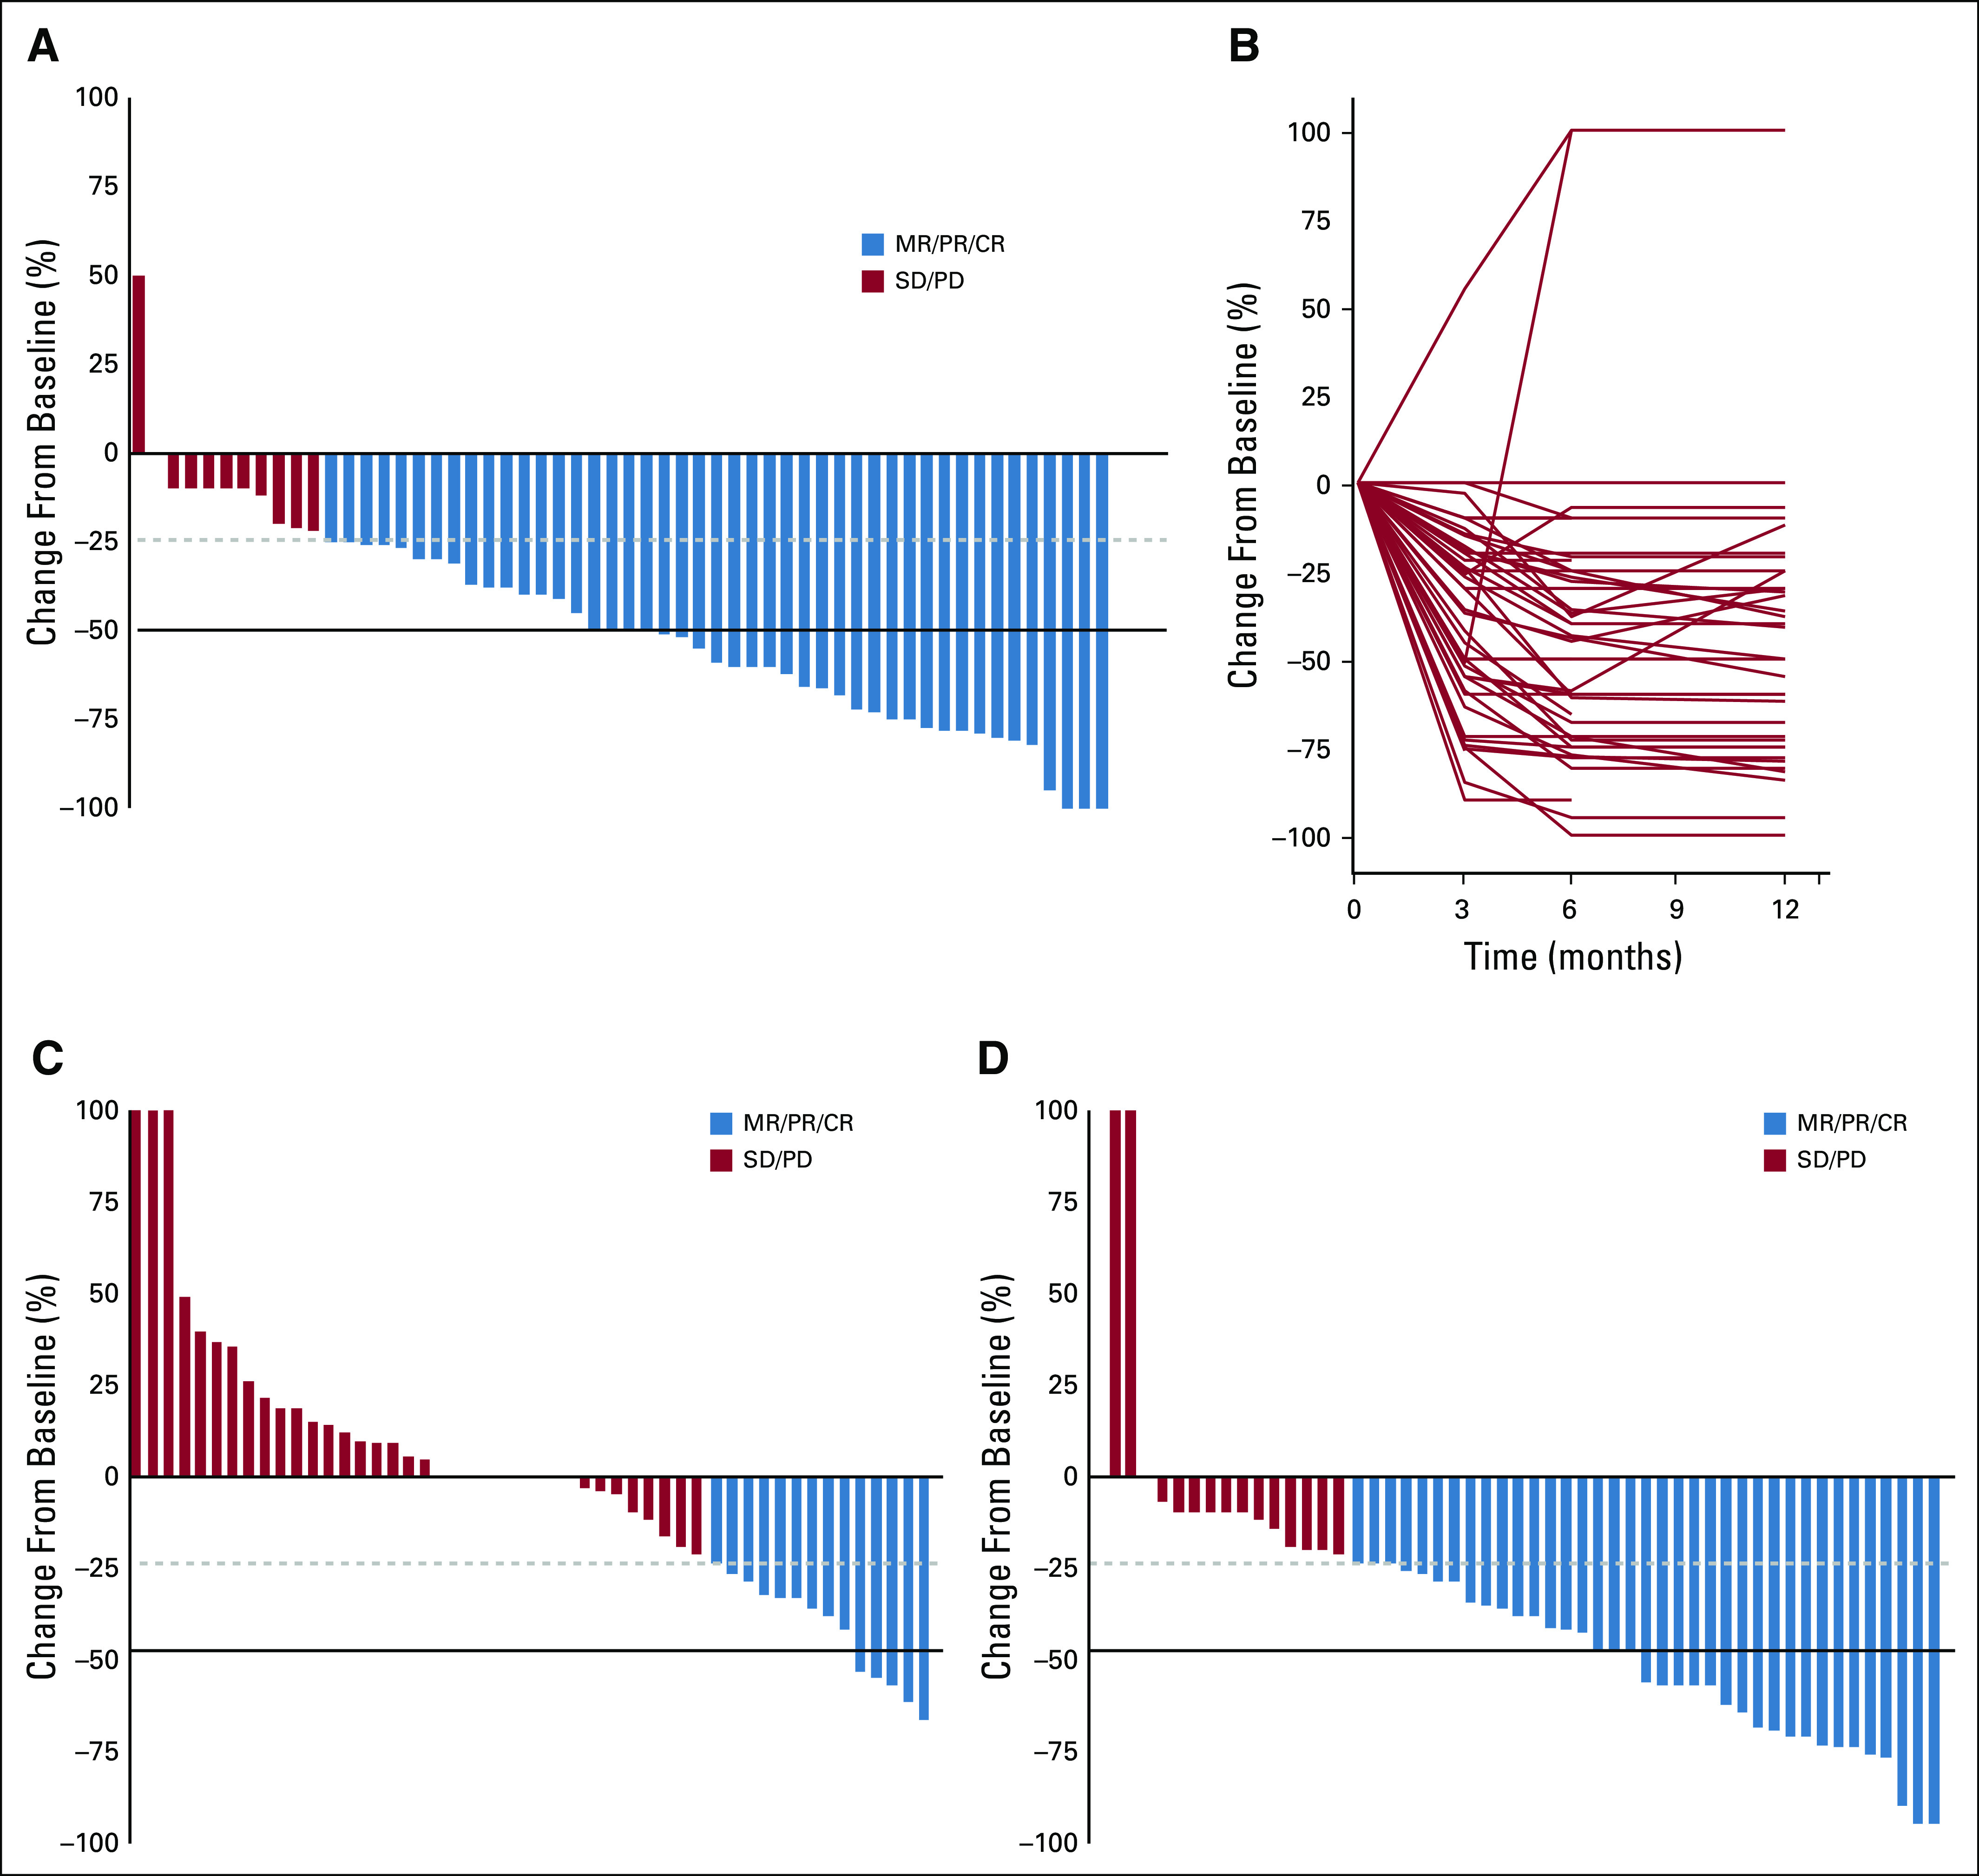
FIG 1.

Response of BRAF V600E–mutated gliomas to BRAF inhibition. (A) Waterfall plot of best response in pediatric low-grade gliomas (PLGGs) to BRAF inhibition as measured by the products of perpendicular measures in T2 or fluid-attenuated inversion recovery magnetic resonance imaging. (B) Spider plot revealing time to response of PLGGs to BRAF inhibition. (C) Waterfall plot of response at 6 months in PLGGs treated with (C) chemotherapy or (D) BRAF inhibition. CR, complete response; MR, minor response; PD, progressive disease; PR, partial response; SD, stable disease.
