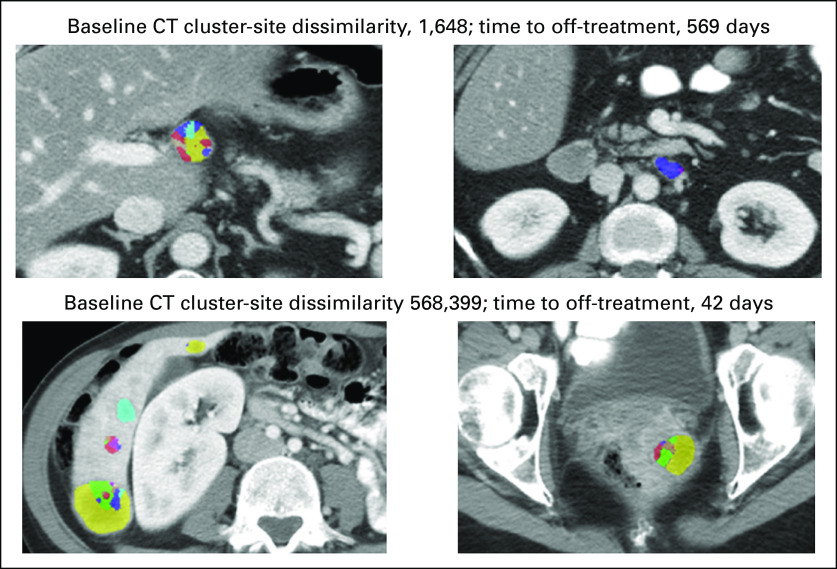
FIG A2.
Axial baseline computed tomography (CT) images from two patients with Haralick texture subregions (used to compute intertumor heterogeneity measures) overlaid on segmented tumors illustrating the association between lower intertumor heterogeneity and longer time to off-treatment (top set of images) versus higher intertumor heterogeneity and shorter time to off-treatment (bottom set of images).

