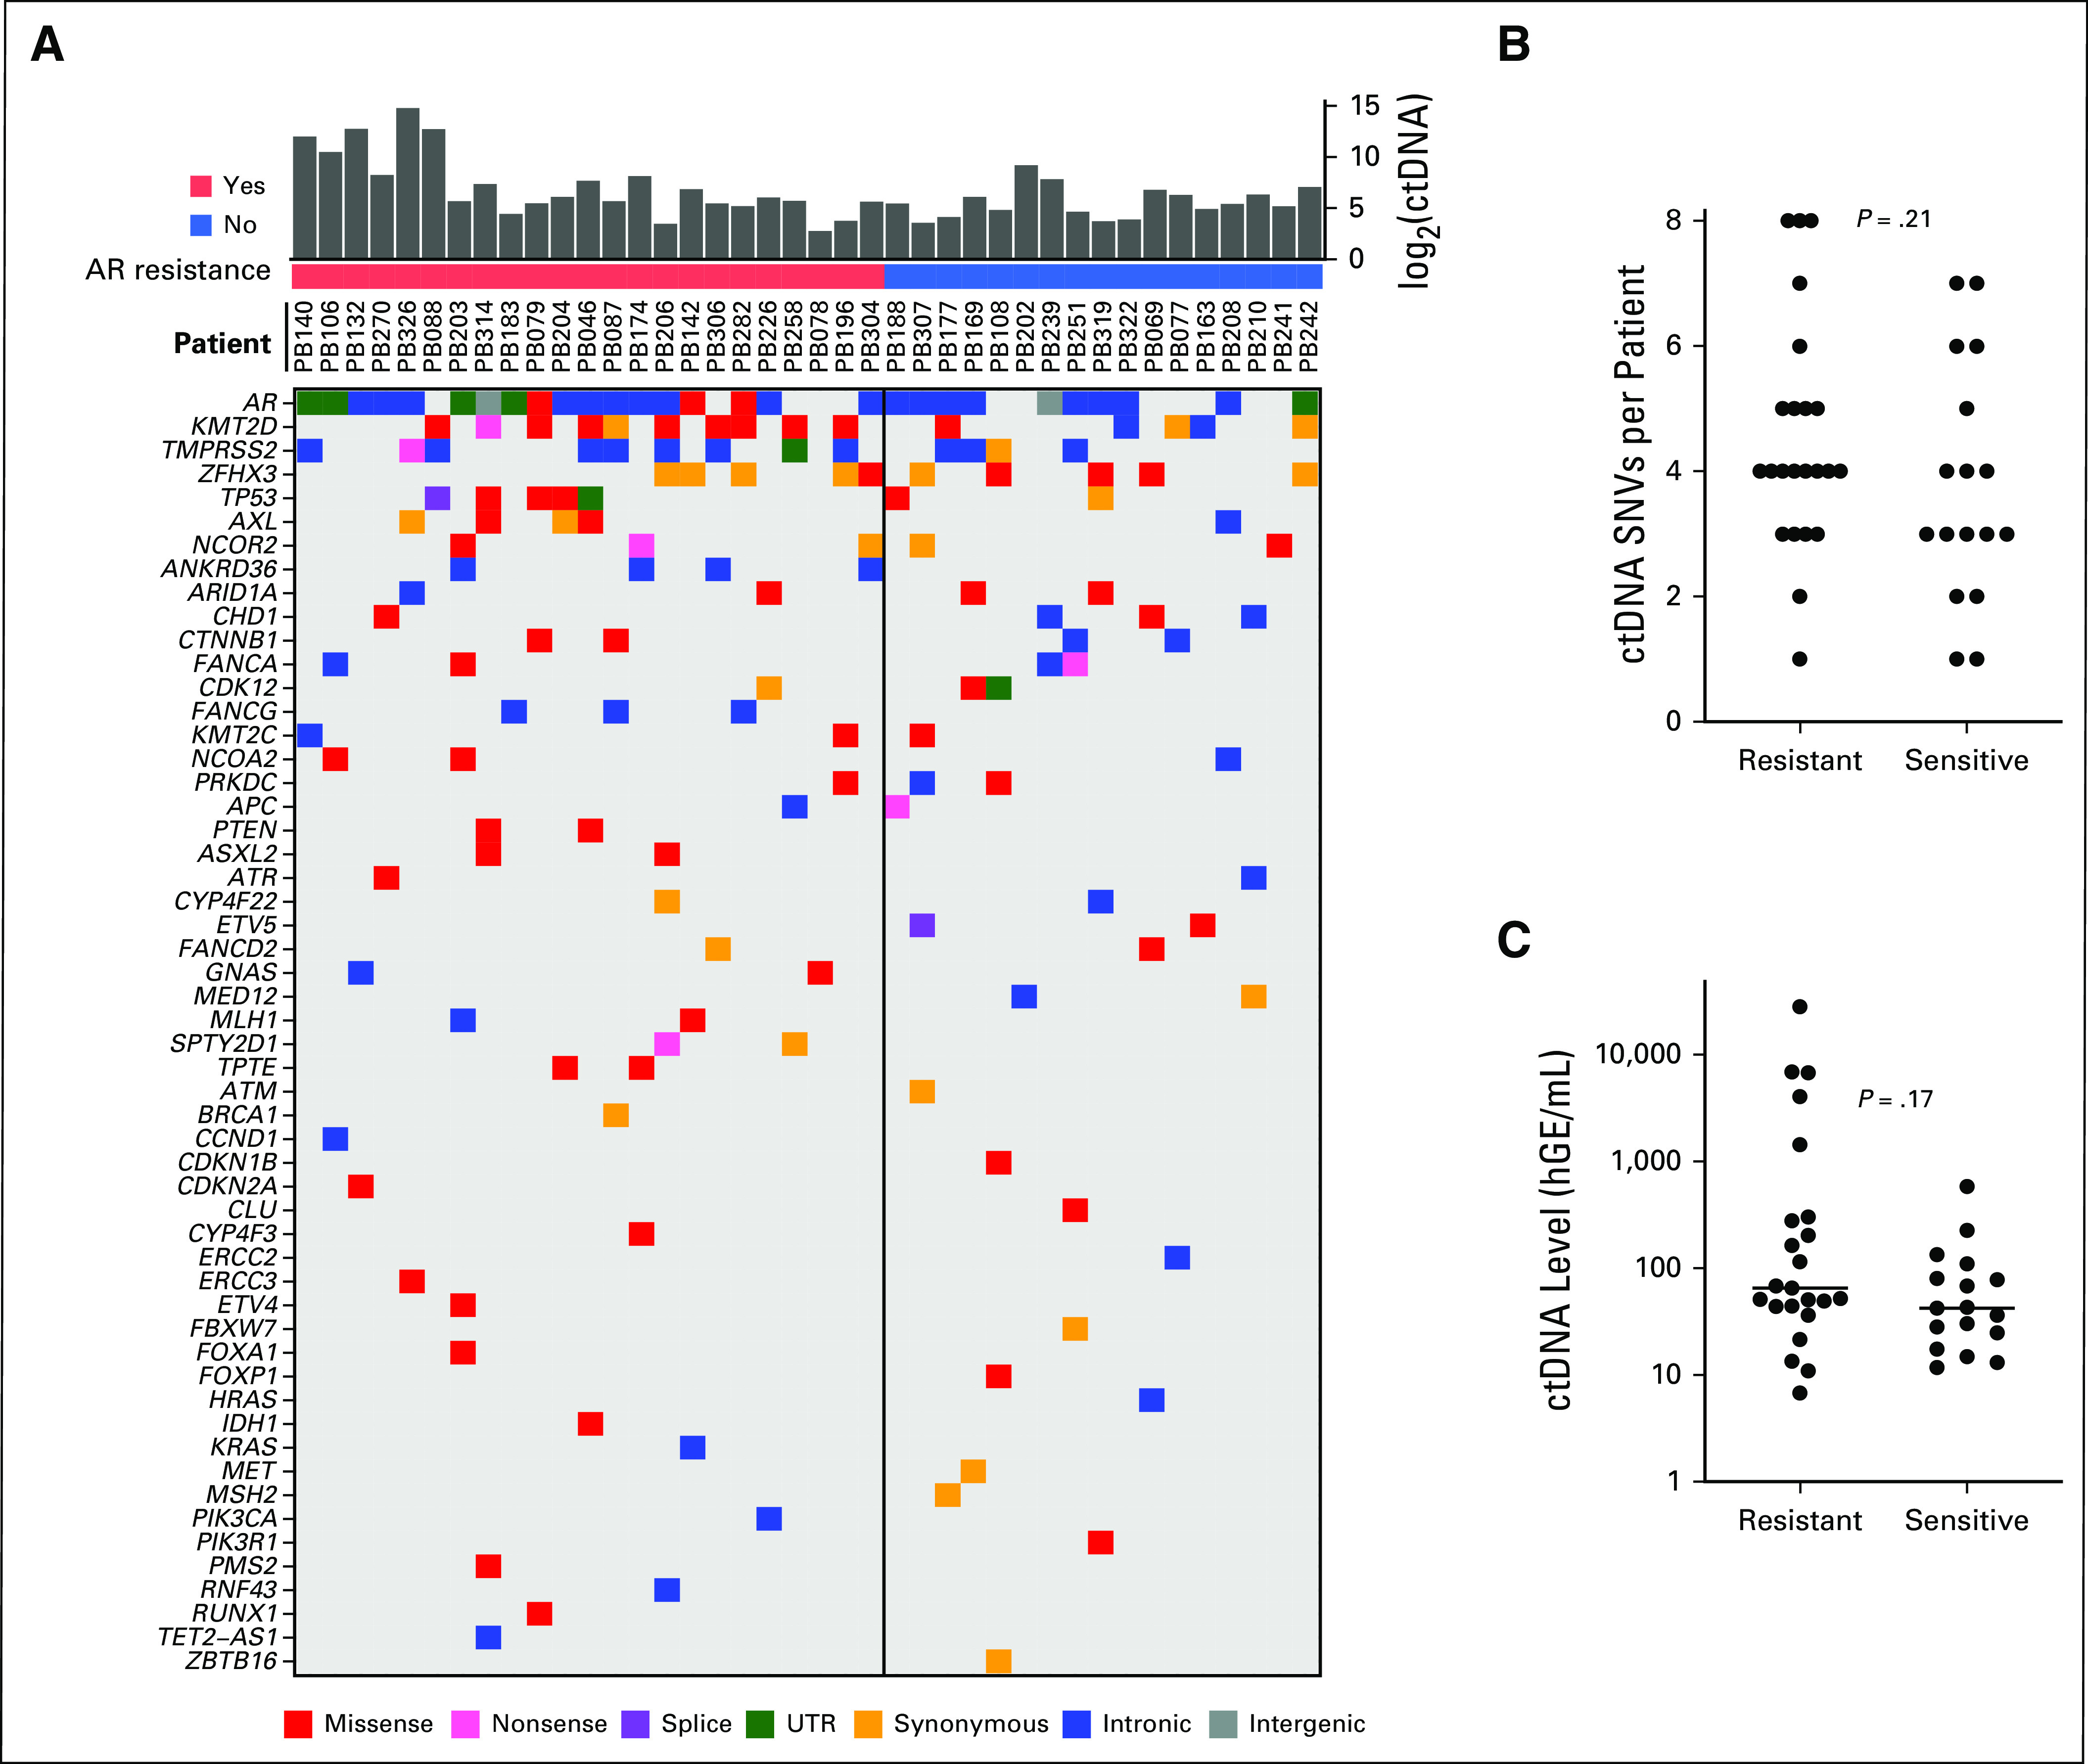
FIG A5.

Single-nucleotide variant (SNV)–based analyses of mutational burden and circulating tumor DNA (ctDNA) levels at baseline. (A) Heat map of all somatic SNVs detected in cell-free DNA from each patient at time of enrollment. Genes are shown on the left and mutation types are indicated by color in the legend below. ctDNA levels are represented in the bar graph on top in log2 space. Resistance to AR-directed therapy is indicated below the bar graph as red (resistant) versus blue (sensitive). (B) Comparison of the number of SNVs and (C) ctDNA levels in AR-resistant versus AR-sensitive patients. ctDNA levels are in haploid genome equivalents (hGE) per milliliter; P values were calculated by Student’s t test. UTR, untranslated region.
