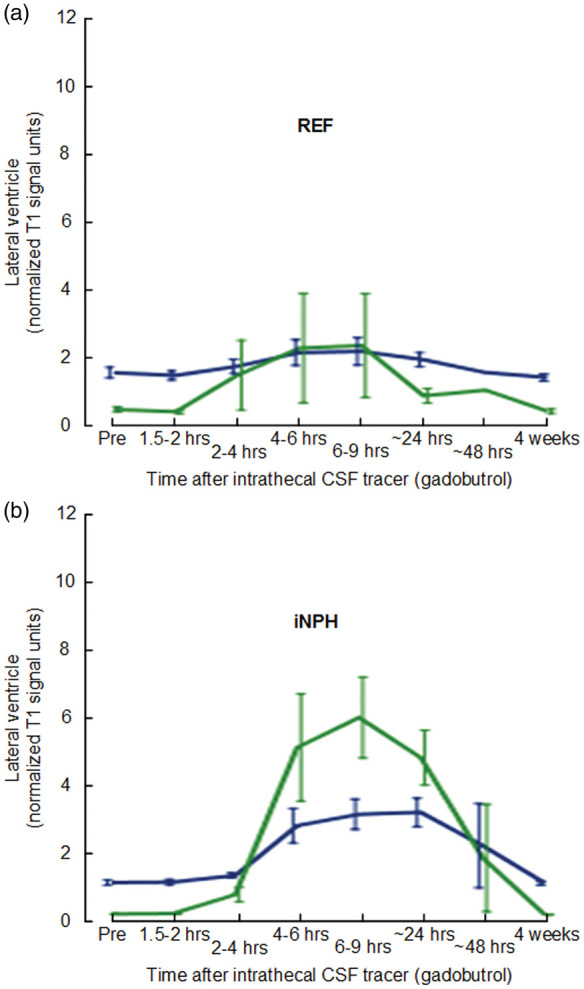
Figure 2.

CSF tracer enrichment in choroid plexus and CSF of lateral ventricle in the REF and iNPH cohorts. Trend plots of signal unit ratios are shown for choroid plexus (blue lines) and CSF (green lines) within lateral ventricle of (a) REF and (b) iNPH subjects. The trend plots are shown as mean ± standard error (SE).
iNPH: idiopathic normal pressure hydrocephalus; REF: reference patients.
