Figure 1.
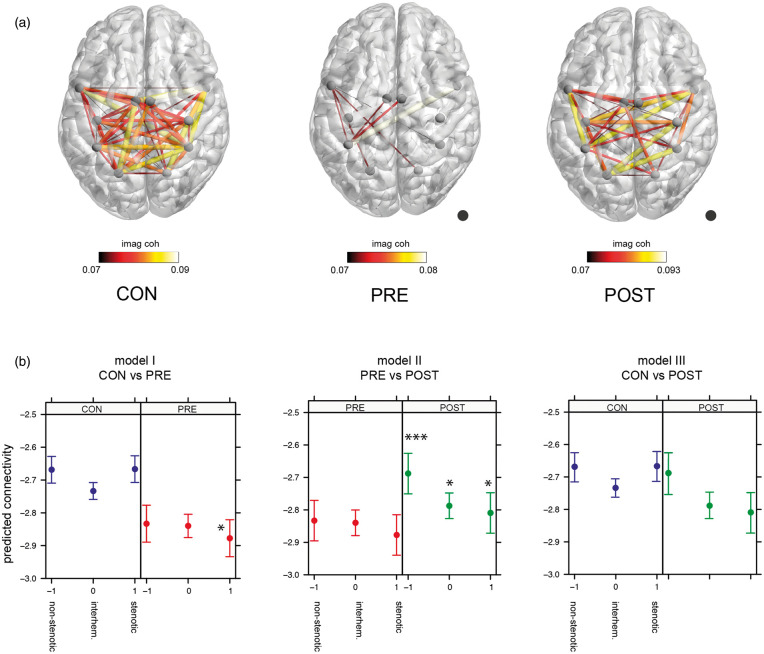
(a) Imaginary coherence of all three groups. Imaginary coherence is plotted as an edge between regions, projected on a template brain. The mean alpha imaginary coherence across participants above a threshold of 0.07 is plotted for each group. Size and color of the edges mark the value of the imaginary coherence. A higher imaginary coherence value represents a greater connectivity between regions. Lighter colors and larger size of connections represent a greater imaginary coherence, whereas darker colors and smaller size represent less imaginary coherence. Dot marks the side of stenosis. (b) Linear mixed model analysis. Effect plot of group × side interaction for each model. Dots mark the predicted connectivity with 95% confidence intervals. Blue: controls (CON); red: patients pre-intervention (PRE); green: patients post-intervention (POST). Side −1 = connectivity on non-stenotic side, side 0 = interhemispheric connections, side 1 = connectivity on stenotic side. Asterixis depict significant post-hoc testing using lsmeans of group × side interaction between groups within the same side. *p < 0.05, ***p < 0.001. CON: controls; PRE: patients pre-intervention; POST: patients post-intervention.

