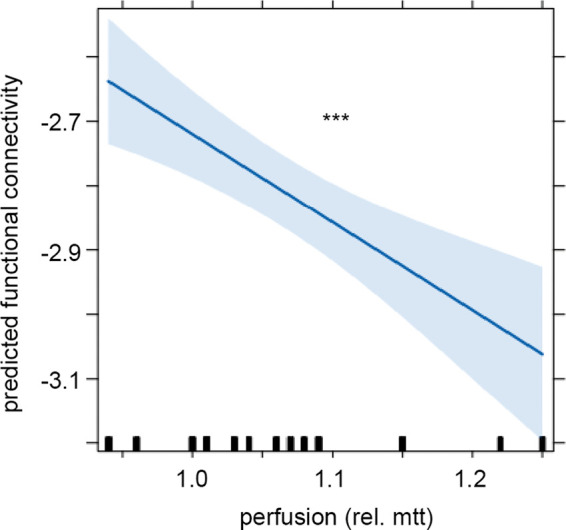
Figure 3.

Linear mixed model analysis of connectivity on the stenotic side and brain perfusion ratio. Effect plot of factor “perfusion”. With a prolonged relative MTT, connectivity on the stenotic side decreases. Line displays the prediction line, shaded area the 95% confidence interval. ***p < 0.001. The rug plot at the bottom of the graph shows the location of perfusion (mtt) values.
