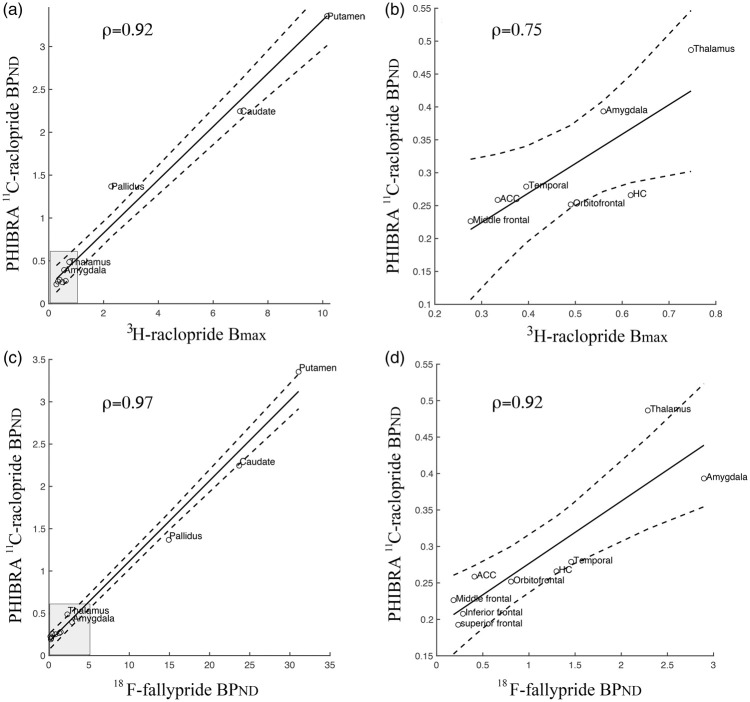
Figure 1.
Regional coherence between our 11C-raclopride BPND measures and previously determined 3H-raclopride Bmax28 and 18F-fallypride BPND51. Scatter plots illustrate associations when including striatum and globus pallidus (a), and low uptake-regions (b), which are visualized in the gray box in (a). Similarly, high correlations were found between our 11C-raclopride BPND measures and 18F-fallypride BPND over regions when including striatum and globus pallidus (d), and only the low uptake-regions (d).

