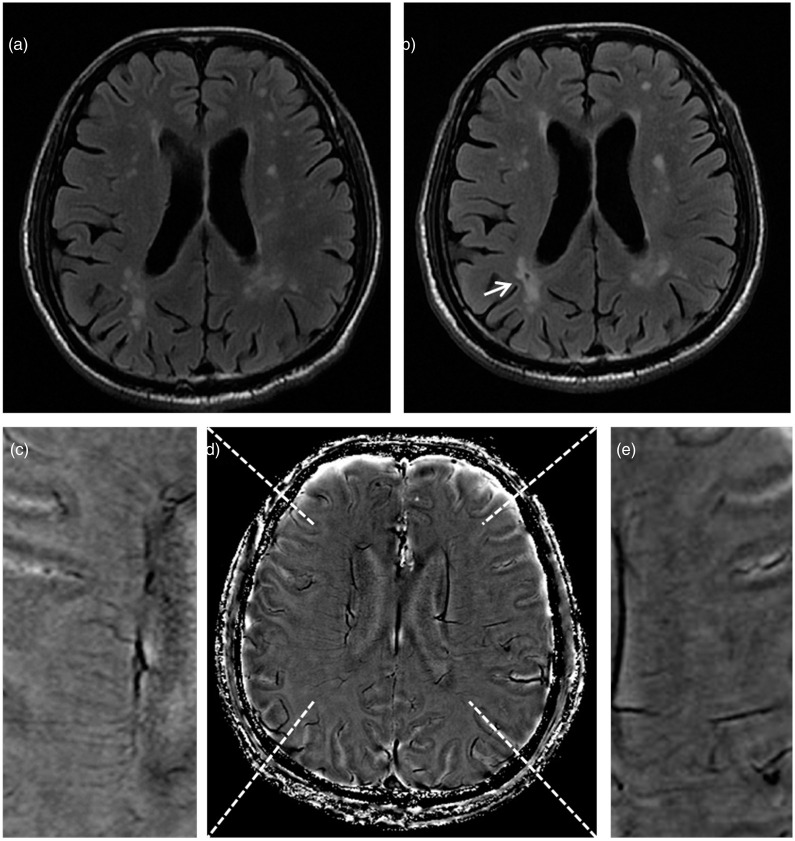
Figure 2.
Representative images showing the relationship between deep medullary veins (DMVs) and the presence of new lacunes. The patient not presenting lacunes on baseline T2-FLAIR images (a) and developed a new lacune (white arrow) on follow-up T2-FLAIR images (b). To note, the white matter hyperintensities also expand, with a lacune appearing within them (b). The patient had DMVs disruption on baseline, with a DMVs score of 14 on baseline Susceptibility Weighted Imaging (SWI)-phase image (d). (c) and (e) are local magnified images of (d).

