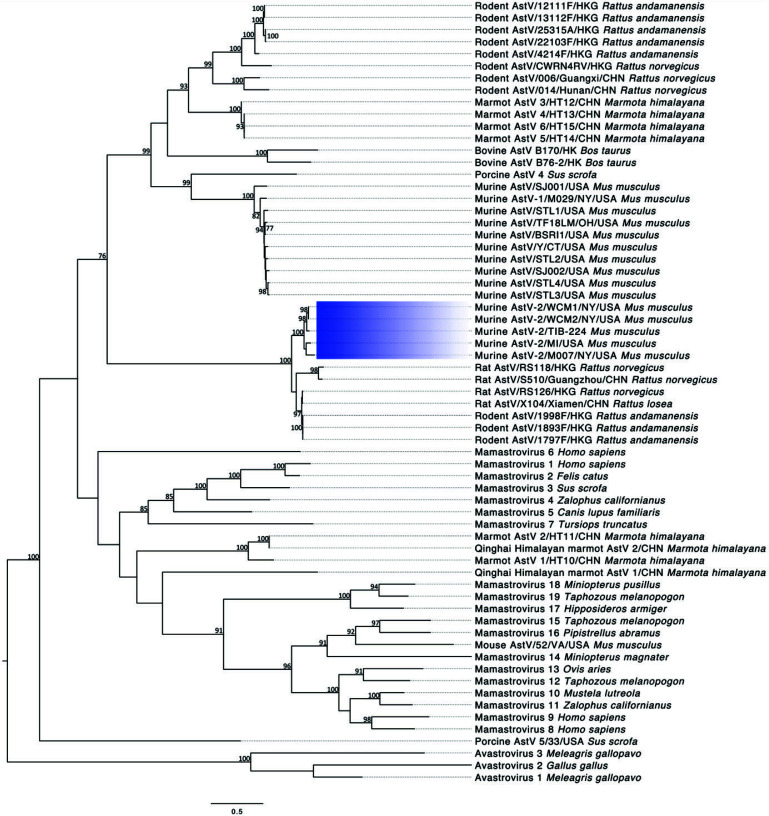
Figure 4.
Phylogenetic analysis of murine astrovirus 2 sequences. The maximum likelihood tree was constructed using the capsid protein sequence. The scale bar represents the number of substitutions per site and bootstrap values are displayed when greater than 70%. Murine astrovirus 2 sequences are highlighted with blue shading.

