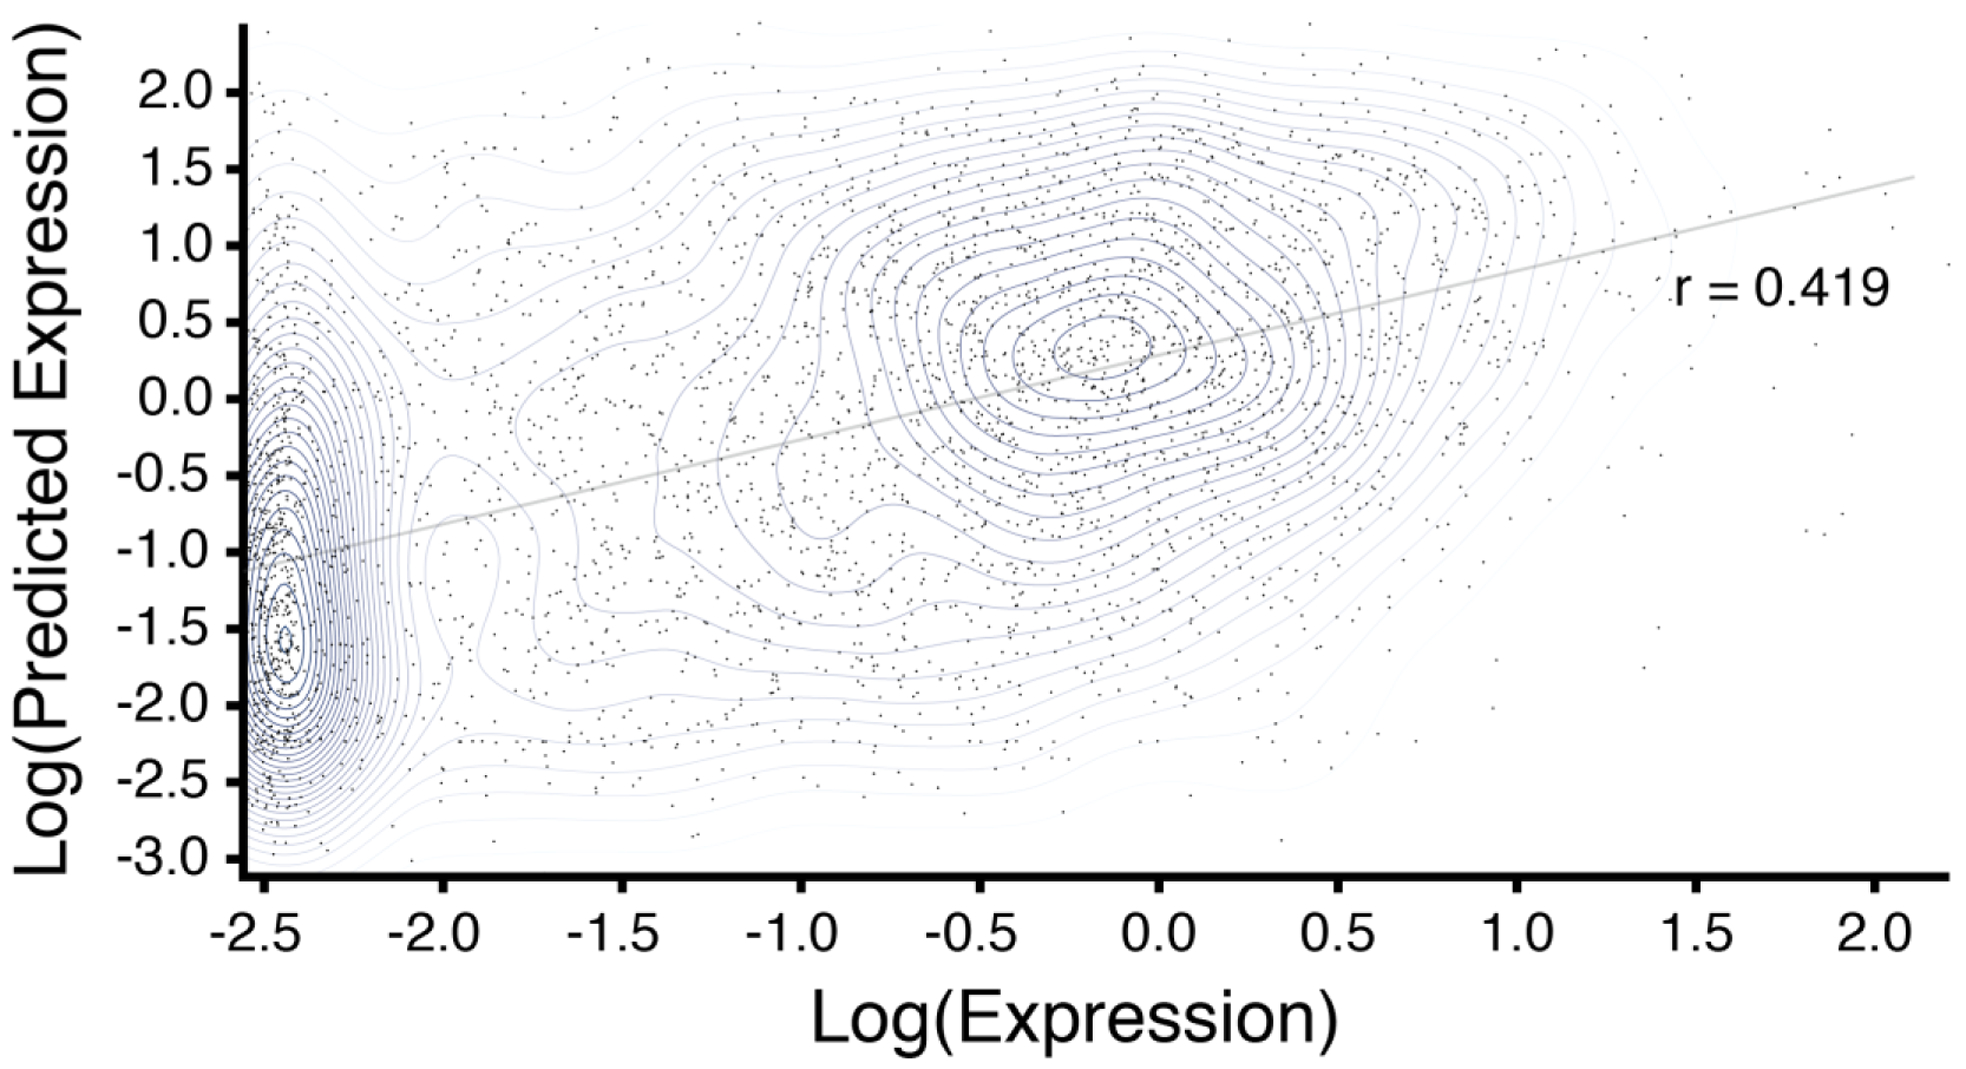
Figure 4. Proximal upstream chromatin class distribution correlates with downstream gene expression.

Actual (x-axis) and predicted (y-axis) leaf tissue gene expression per class coverage on chromosome 1. The predicted expression is derived from a multiple linear regression model of upstream chromatin classes used as covariates against gene expression for protein coding genes on rice chromosomes 2–12 [r2 = 0.18, (grey line)].
