
Figure 2.
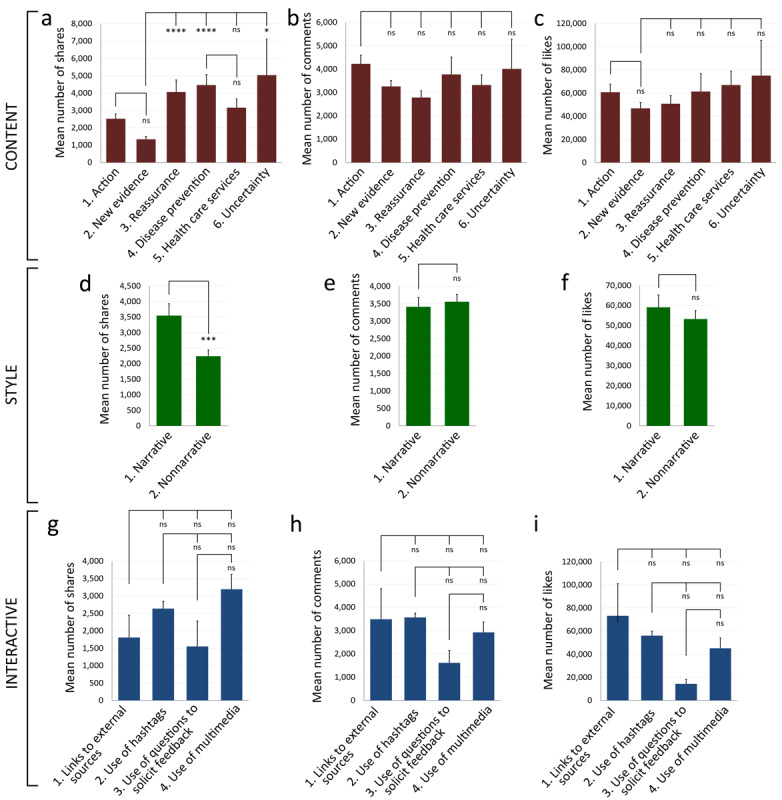
Comparison of the mean number of shares, comments, and likes for posts of each subdimension. Mean number of (a) shares, (b) comments, and (c) likes of the subdimensions of the content dimension. Mean number of (d) shares, (e) comments, and (f) likes of the subdimensions of the style dimension. Mean number of (g) shares, (h) comments, and (i) likes of the subdimensions of the interactive dimension. *P<.05, **P<.01, ***P<.001, ****P<.0001. All histograms depict mean and standard error of the mean.