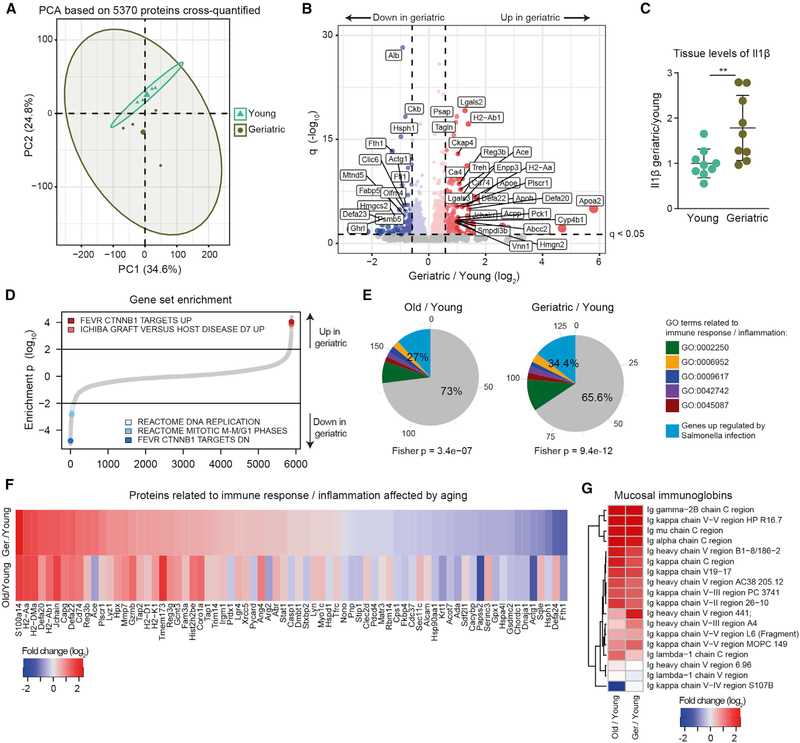
Figure 2. Proteome Changes in Intestinal Crypts during Aging.
(A) Principal-component analysis based on protein intensities measured by DIA mass spectrometry (n = 4).
(B) Volcano plot depicting proteins that significantly increase (red) or decrease (blue) abundance with aging (Table S2). Proteins not affected are shown in gray. Horizontal dashed line indicates a significance cutoff of q < 0.05 and vertical dashed lines an absolute fold change (log2 > 0.58.
(C) Ilβ levels measured by ELISA in the jejunum of young and geriatric animals (n = 9), represented as mean ± SD.
(D) Gene set enrichment analysis. Gene sets are plotted according to the log10 value of the calculated enrichment score. Positive and negative values are used for gene sets showing higher and lower abundance in old crypts, respectively. Selected significantly affected gene sets (q < 0.25) are highlighted. The complete list of enriched gene sets is reported in Table S2.
(E) Overlap between significantly regulated genes involved in response to bacterial infection (Haber et al., 2017, FDR < 0.25) and proteins significantly upregulated in aging. Fisher test was performed comparing significantly upregulated genes versus all other genes.
(F) Fold changes (log2) of significantly affected proteins related to bacterial/immune response.
(G) Heatmap showing age-related changes in abundance of mucosal-specific immunoglobulins during aging.

