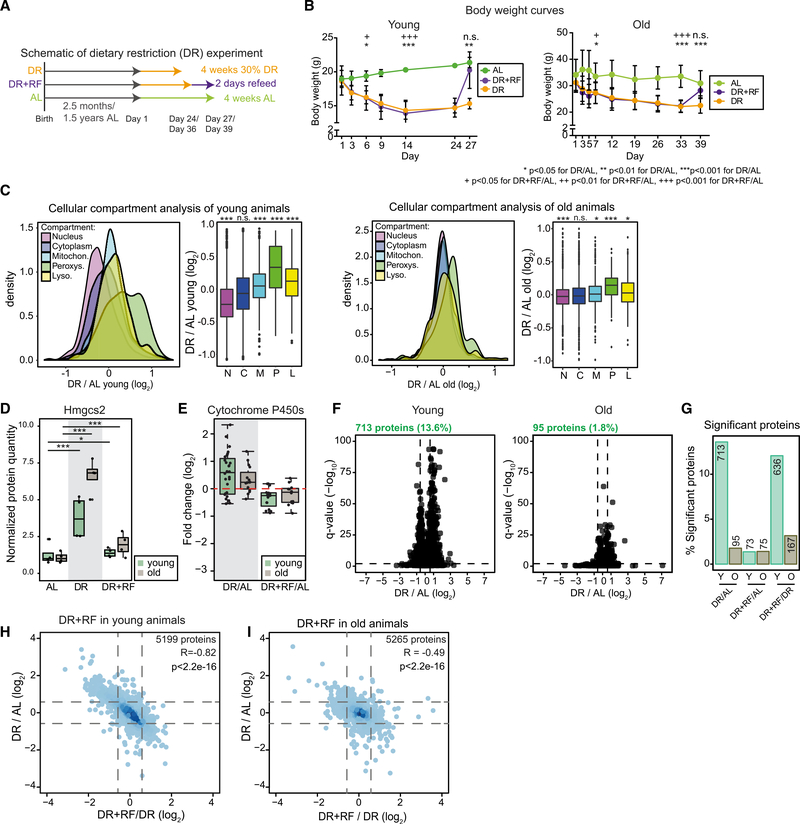
Figure 4. Comparison of the Effect of Dietary Restriction (DR) in Young and Old Mice.
(A and B) Schematic of short-term DR experiment (A) and body weights of treated young (n = 4) and old (n = 6–8) animals (B) shown as mean ± SD. *p < 0.05 for DR/AL, **p < 0.01 for DR/AL, ***p < 0.001 for DR/AL, +p < 0.05 for DR+RF/AL, ++p < 0.01 for DR+RF/AL, +++p < 0.001 for DR+RF/AL, one-way ANOVA for multiple comparisons with Tukey’s correction.
(C) Cellular compartment analysis (Parca et al., 2018) of crypt proteome upon DR of young and old animals (Wilcoxon rank sum test with continuity correction).
(D) Protein abundance of Hmgcs2 in crypts of young and old animals (n = 4). Abundance level is shown as normalized protein intensity (mean of AL-fed mice = 1).
(E) Abundance of significant (q < 0.05) enzymes of the cytochrome P450 superfamily shown as fold changes (log2) of the comparison of DR and DR+RF animals to AL.
(F) Volcano plots showing all proteins changed by the DR treatment in young (left) and old (right) animals, horizontal dashed line indicates a significance cutoff of q < 0.05 and vertical dashed lines an absolute fold change (log2) > 0.58 (n = 4).
(G) Percentage of significantly affected proteins in crypts from young and old AL-, DR-, and DR+RF-treated animals, shown as percentage of all identified proteins in the indicated comparison. Numbers above bars are total numbers of significant proteins.
(H and I) Comparison of protein changes induced in young (H) and old (I) animals by DR and DR+RF. All proteins quantified in both comparisons are shown.

