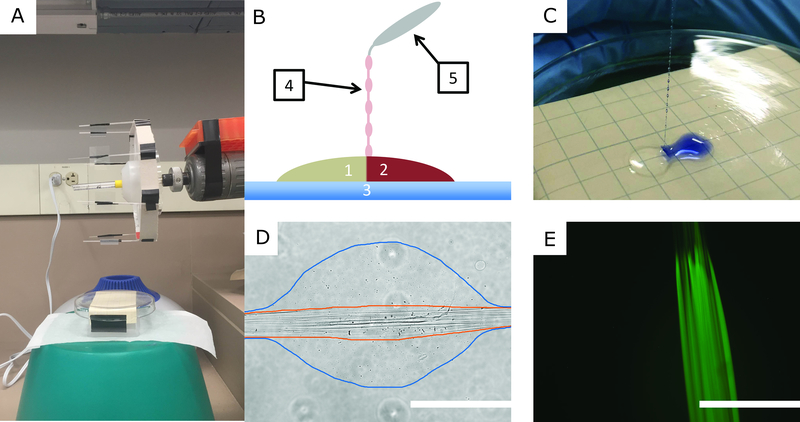
Figure 1.
IPC Fiber Formation and Characterization. A. A picture of the IPC-fiber spinning apparatus. B. Cartoon showing IPC fiber formation: Oppositely charged polyelectrolyte solutions (1,2) are brought together on a glass surface (3). An IPC fiber (4) is drawn by grasping the interface with forceps (5) and pulling upward. C. Photograph of IPC fiber formation using an alginate solution dyed with Trepan Blue. D. Transmitted light micrograph of an IPC fiber. The nuclear fiber bundle is outlined in orange and the loosely complexed hydrogel bead is outlined in blue. E. Fluorescence micrograph of an IPC fiber formed using an alginate solution dyed with fluorescein sodium salt. Scale bars: 400 μm.

