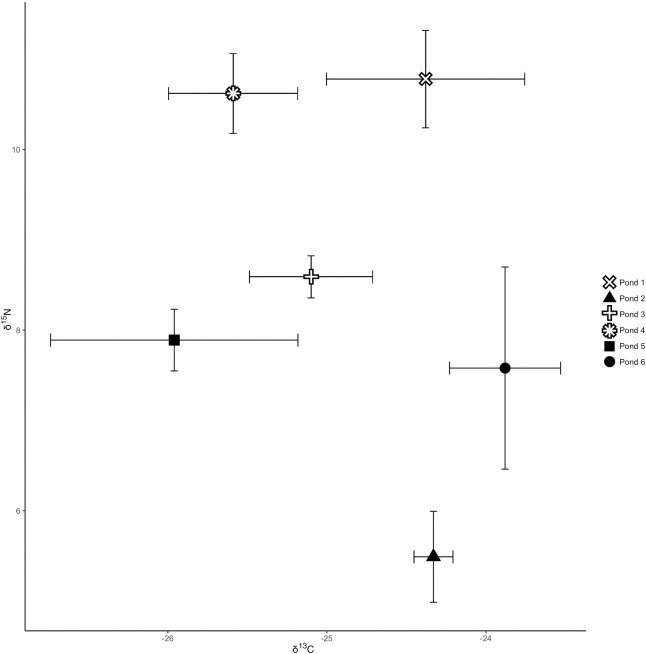
Fig 2. Bray-Curtis dissimilarities of the GIFT microbiome.
Non-Metric multidimensional scaling (nMDS) plot based on Bray-Curtis dissimilarity of the bacterial communities of GIFT fed different diets (P = 0.001). Pellet-fed fish are represented by solid, black shapes with vegetable-fed fish represented by red symbols. Stress = 0.1703505.

