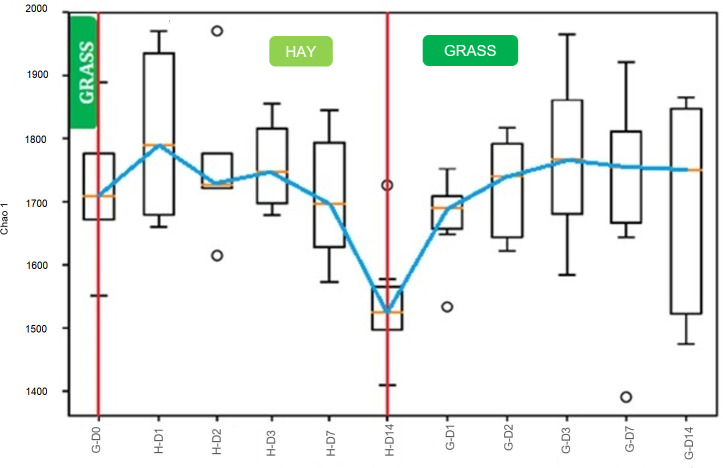
Fig 2. Chao1 for bacterial communities in the faeces of the ponies for different days of experiment.
Boxplot comparing estimated richness (n = 6). Red bars show abrupt changes: 1st from grass (G) to hay (H), 2nd from hay to grass. Blue line connects the means (orange lines). Circles represent outliers. D: days.

