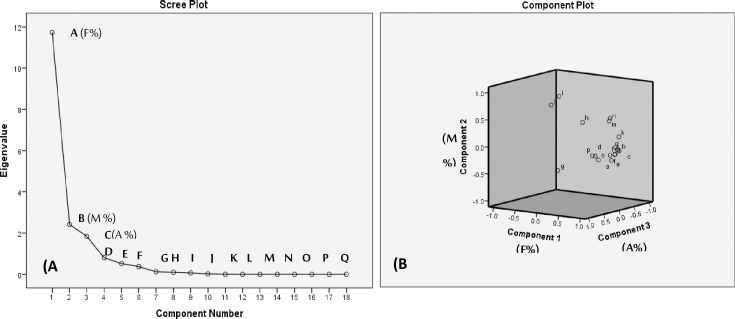
Fig 8.
The scree plot of eigenvalue (A) and loadings plot (B) for the component number of the measured parameters for common bean plants under salinity stress in response to treatments with AMFandTiO2NPs: A:F% Frequency of mycorrhizal root segments, B:M% intensity of mycorrhizal colonization, C:A% arbuscule frequency in root systems, D:(MD) mycorrhizal dependency, E:Dry Wt. (g), F:Efficiency of inoculants, G:Tolerance index %, H:Tio2NPs concentration in root, I:Tio2NPs concentration in shoot, J:(T.F) Translocation Factors, K:(P) content, L:(K) content, M:(N) content, N:Protein content, O:Peroxidase activity, P:Catalase activity, Q:Acid Phosphates and R: Alkaline phosphates.

