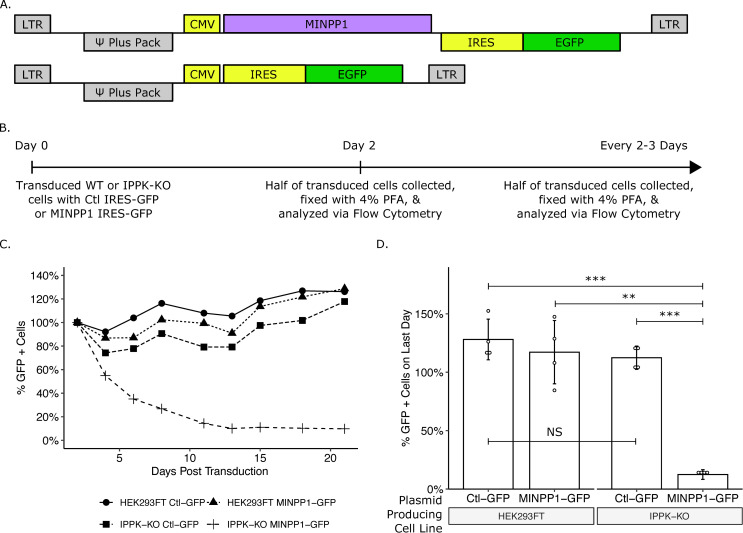
Fig 4. Exogenous expression of MINPP1 is toxic in IPPK-KO cells.
(A) Plasmid map of expression vectors. (B) Experimental timeline. (C) Line plot of a representative experiment. The percentage of cells expressing EGFP over time are normalized to the starting population of EGFP positive cells for each cell line. (D) Bar chart of percent EGFP positive cells on the last day of collection from panel C (day 21). Student’s t-test was used for pair-wise comparison (n = 4, ** p < 0.01, *** p < 0.001, error bars = mean ± SD).

