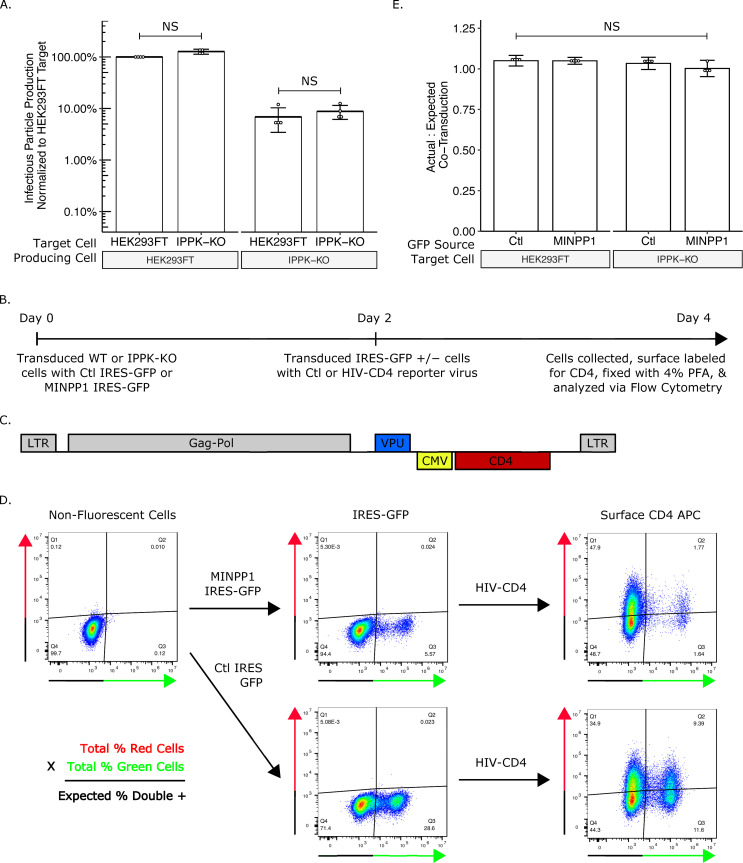
Fig 6. IP6 and IP5 levels in target cells do not affect susceptibility to HIV-1 infection.
(A) Bar chart of percent infectious particle release normalized to HEK293FT cells. Student’s t-test was used for pair-wise comparison (n = 4, * p < 0.05). (B) Experimental timeline of the assay. (C) Plasmid map of HIV-1ΔEnv-CD4. (D) Example flow plots show output from the assay. (E) Bar chart of the ratio of the actual percent double positive cells to the expected double positive cells. The expected percent of double positive cells was calculated from the total percent of red cells and green cells. Student’s t-test was used for pair-wise comparison (n = 4, * p < 0.05, error bars = mean ± SD).

